Understanding Base Maps, Tile Services and Vector Tiles
Table of contents:
This article explains the Map Tiles and the basic behind it. It also explains the two map tiling methods raster tiles and vector tiles.
License: This article is licensed under the Creative Commons Attribution-ShareAlike 4.0 International (CC BY-SA 4.0) license.
Let’s analyse the general flow
Need a map? → Download vectors and rasters → Clean data → Store locally → Style it → Repeat next time!
What if mapping didn’t start with downloading?
Base Maps
A base map is the background reference layer on which you place your data. It provides geographic context, such as:
- Roads
- Rivers
- Buildings
- Administrative boundaries
- Land use
- Labels
If you remove all your thematic layers (for example, crop map, flood extent, health facilities, etc.), the map that remains underneath is the base map. Examples are the OpenStreetMap Standard Map, Google Maps Road Map, Esri World Topographic Map, etc.
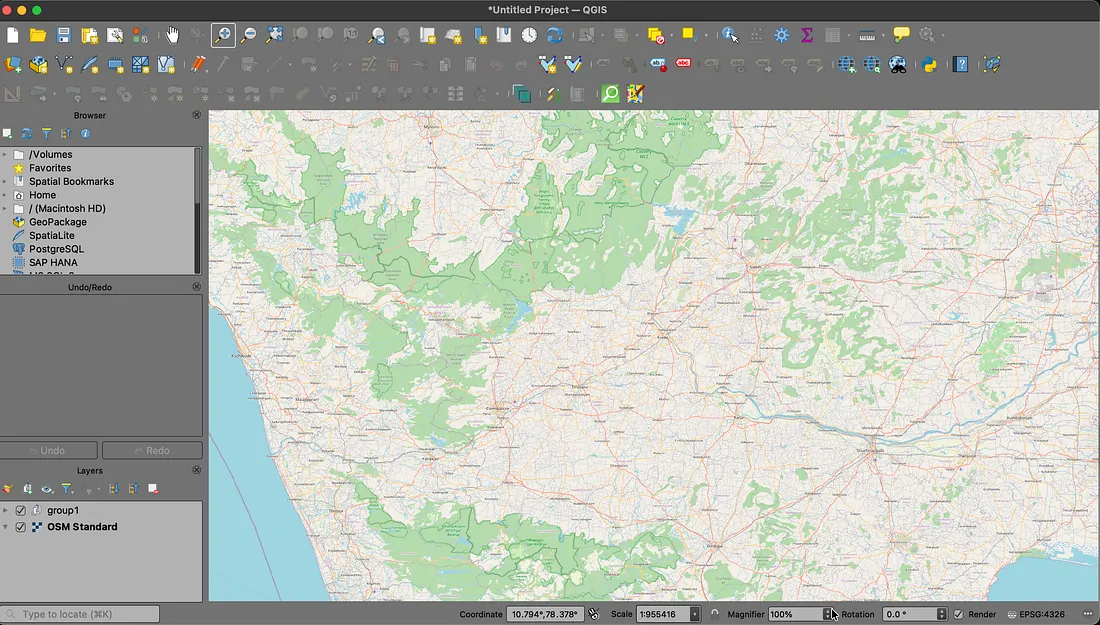
OpenStreetMap Standard basemap loaded in QGIS
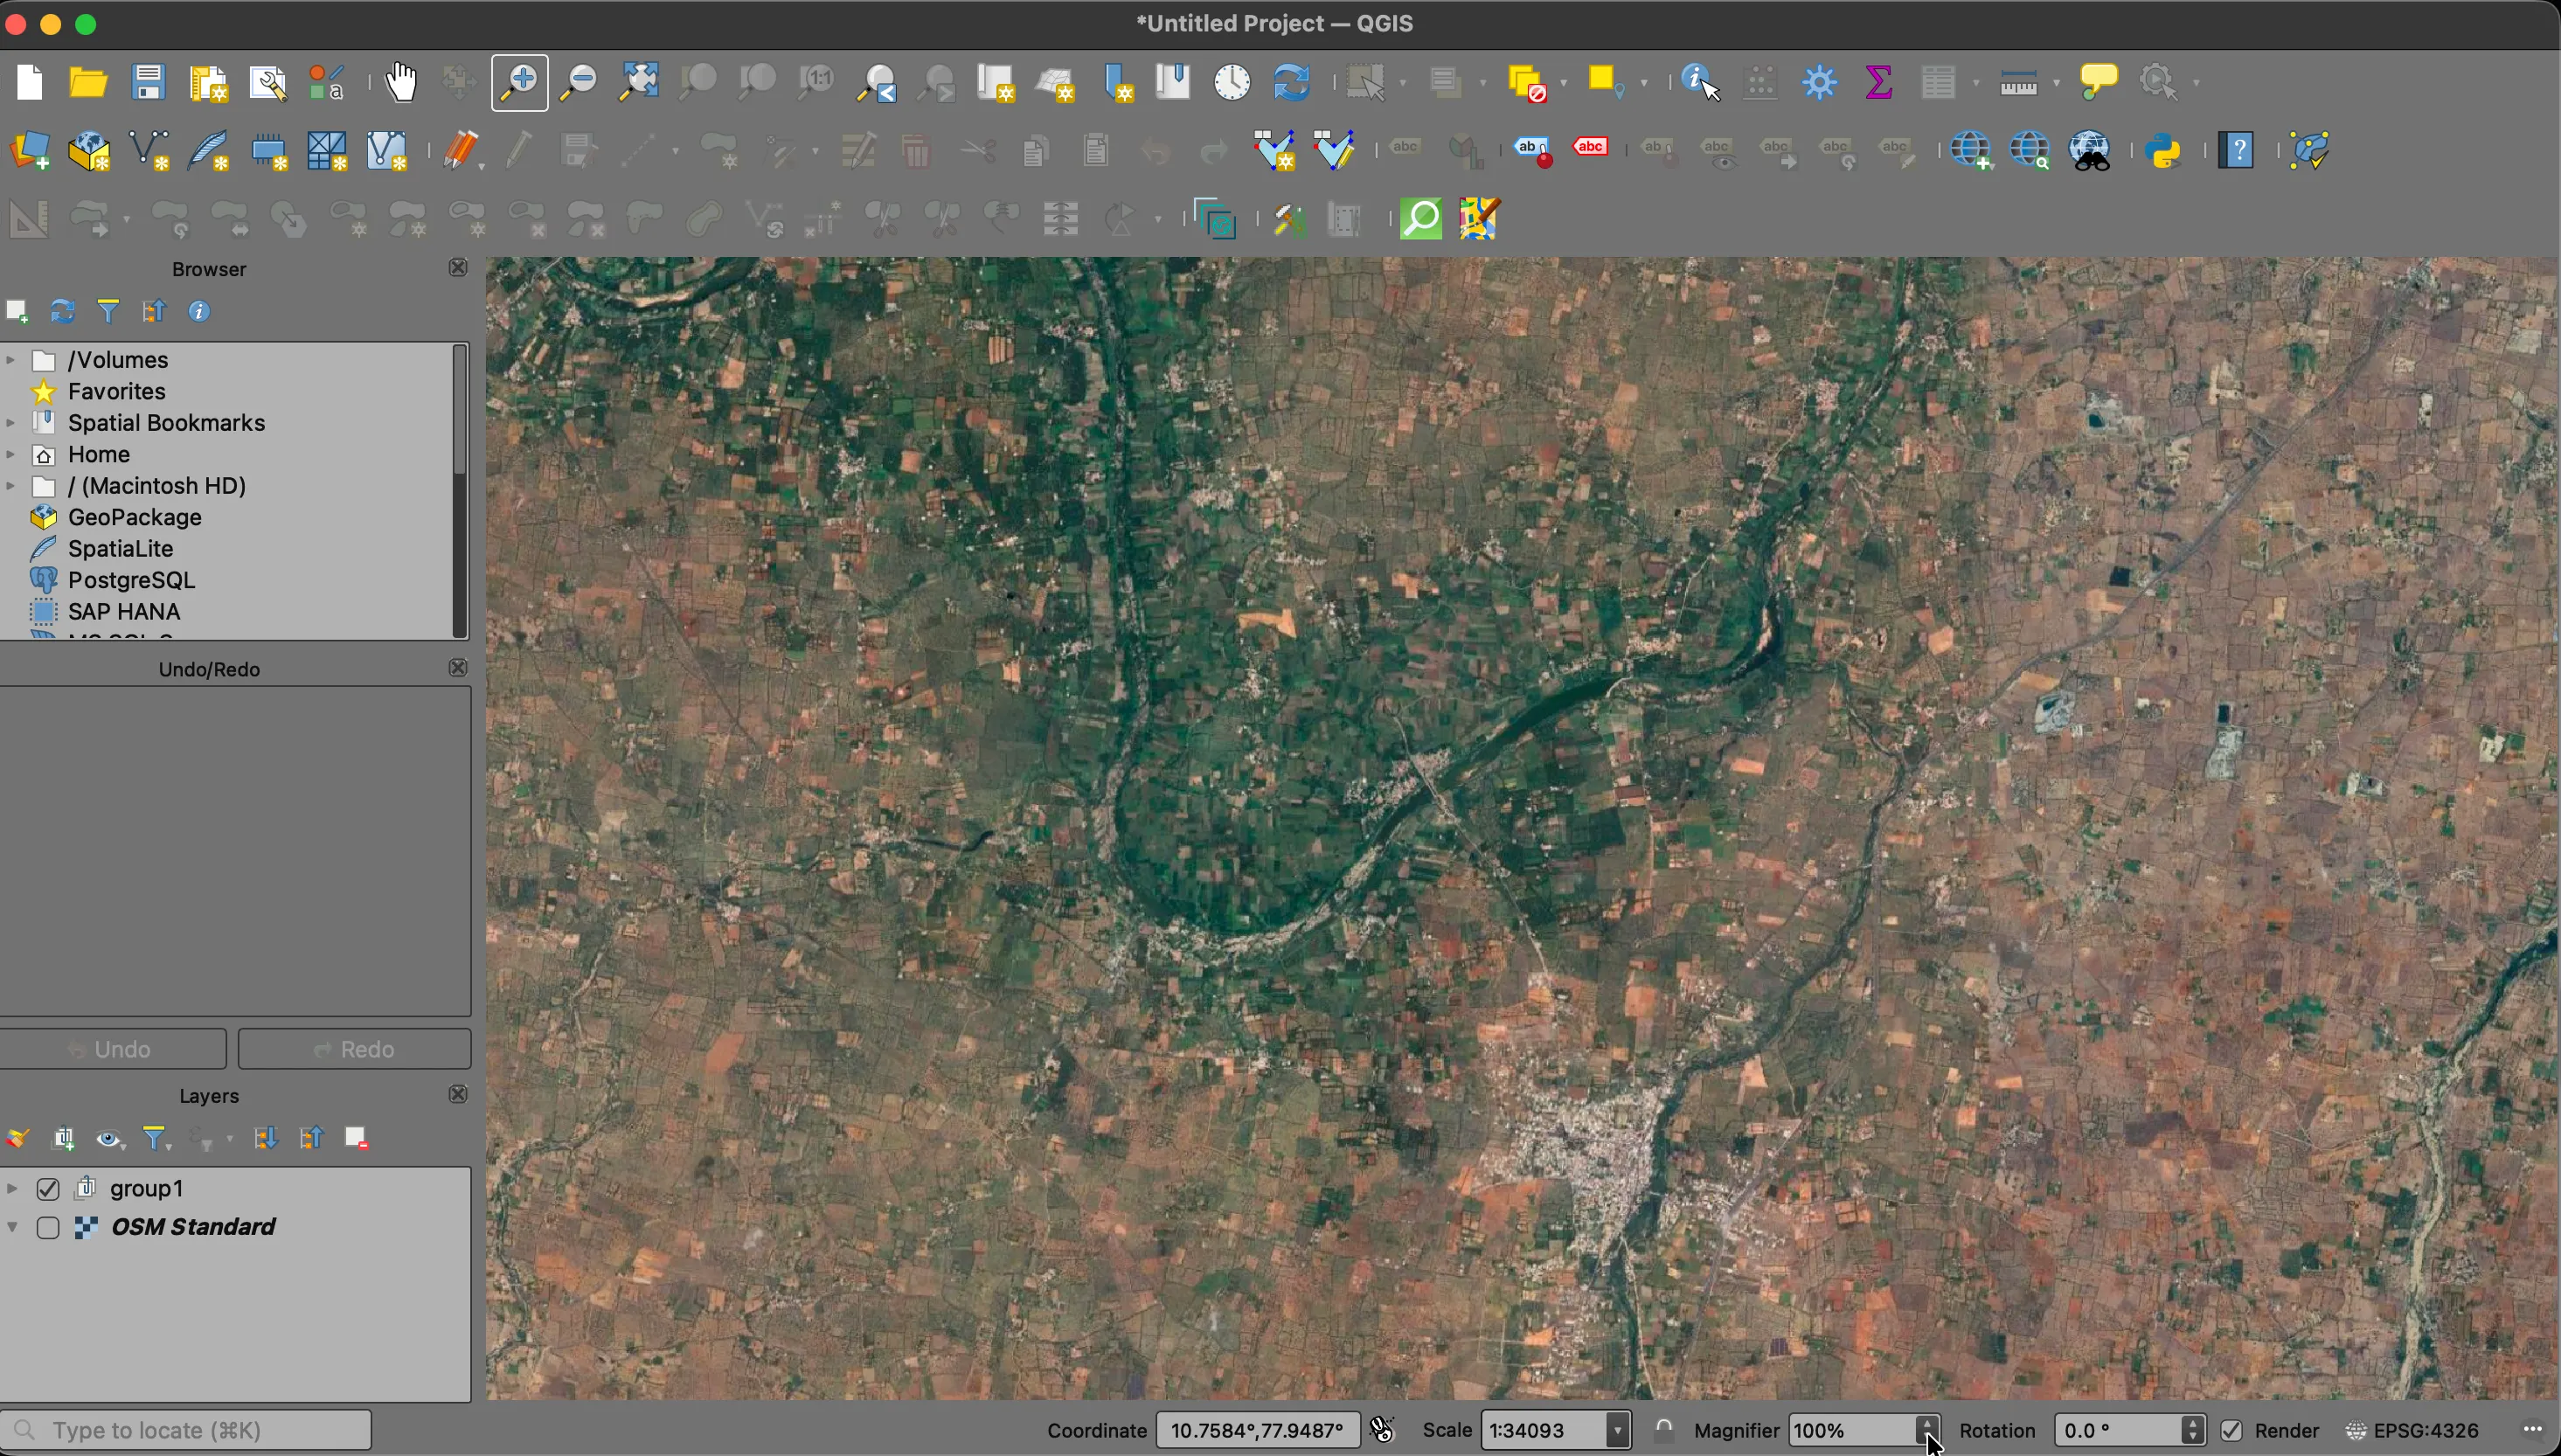
Google Satellite basemap loaded in QGIS
Base map = Where am I?
Thematic layer = What is happening here?
In other words a basemap is the stage and all your thematic layer are your actors.
Basemaps are mostly delivered through Tile Services.
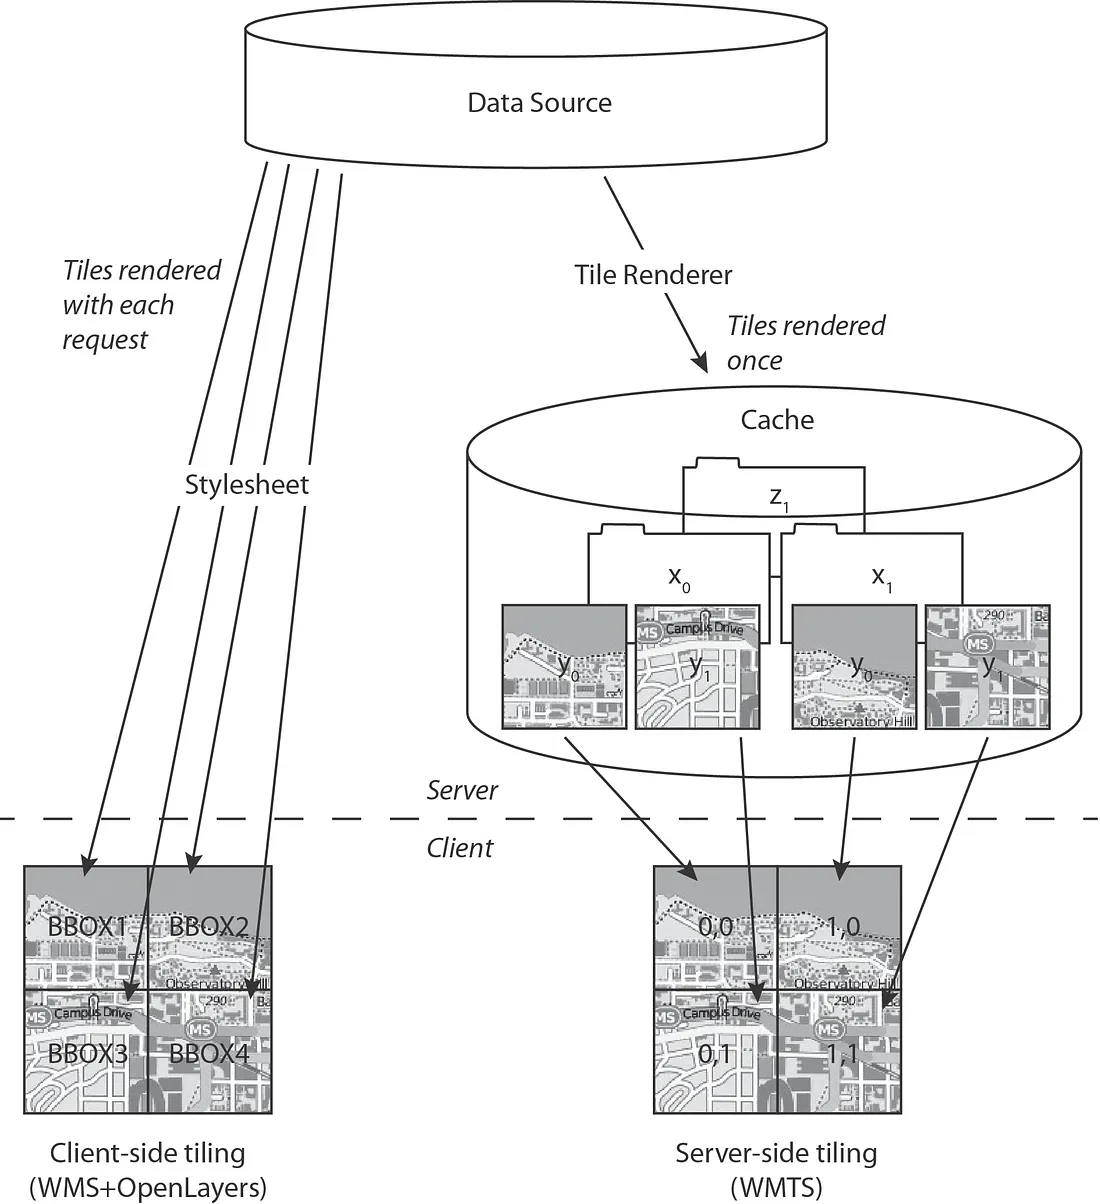
Tile Services
Instead of sending one large global map file, modern web maps divide the world into small square images called tiles. These tiles are served through a tile service. Tiles can be served in two ways: as rasters and as vectors. The tiling methods are chosen according to the characteristics of the data to be streamed. For example, if the data is a basemap of a satellite image, raster tiling is preferred, while if the data is a basemap of a street map, a vector service option can be used. Let’s see how the tile service works for a world base map : The world is:
- Projected into the Web Mercator projection (EPSG:3857 CRS).
- Divided into a grid.
- Split into small squares (usually 256×256 pixels).
- Loaded dynamically as you pan and zoom.
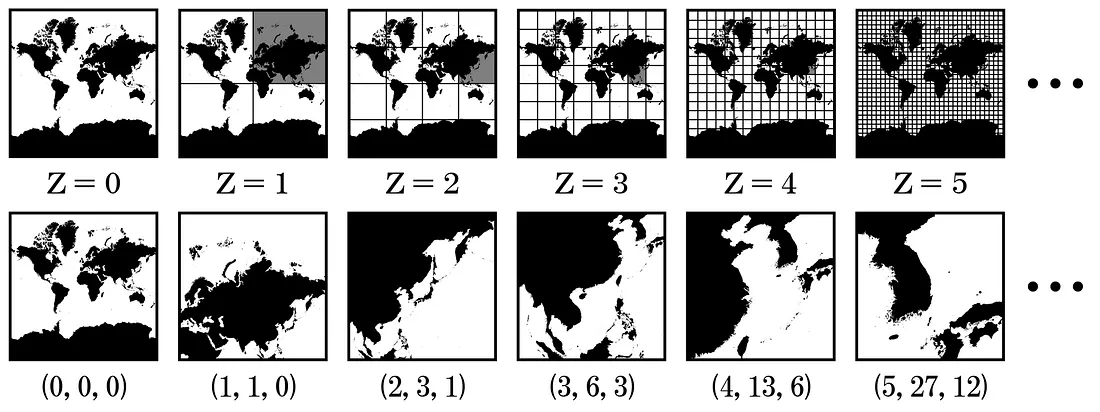
How Tiling Works. Image: AsPJT, CC0, via Wikimedia Commons
At each zoom level, the number of tiles increases:
- Zoom 0 is 1 tile (whole world)
- Zoom 1 is 4 tiles
- Zoom 2 is 16 tiles
- Zoom 3 is to 64 tiles
…and so on.
(0,0,0) can be read as (z,x,y) where
z → Zoom level
x → Tile column (horizontal position)
y → Tile row (vertical position)\
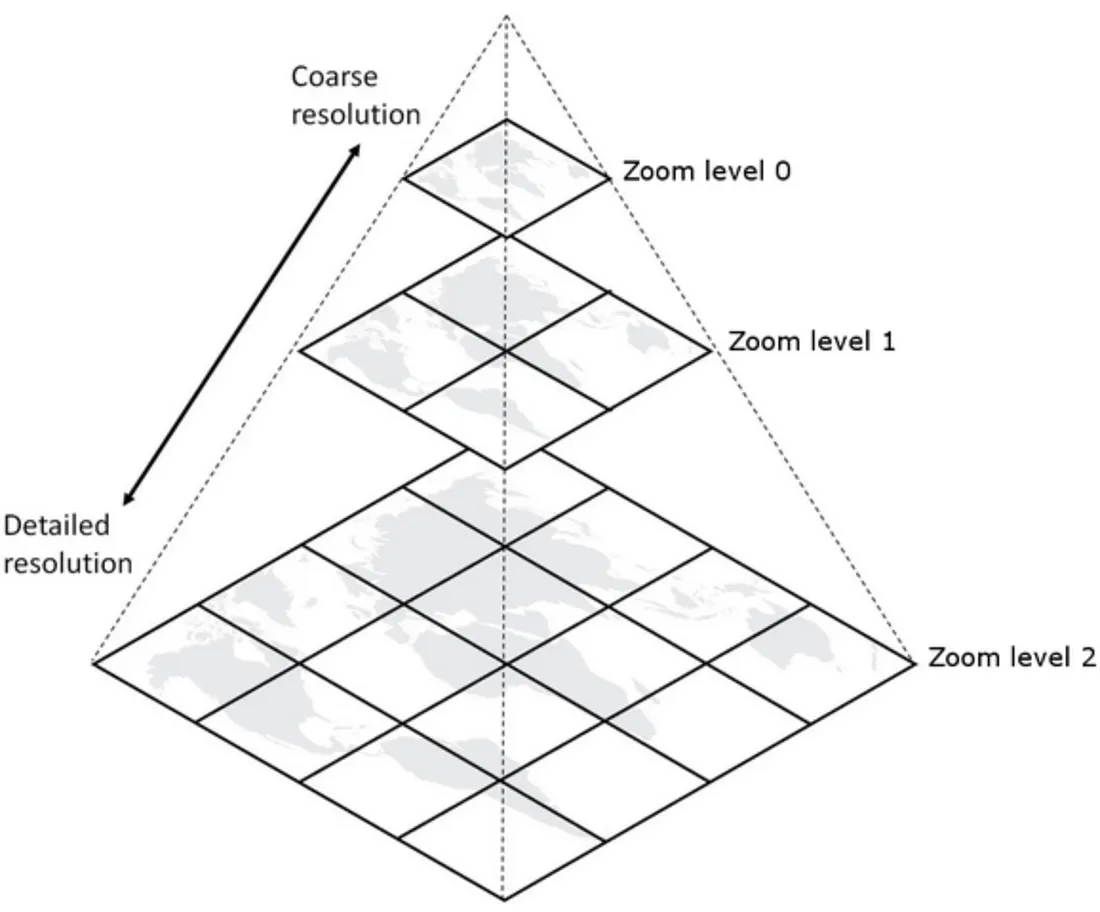
Zoom Pyramid or Tile Pyramid. Image: cumbriasoaringclub
Every zoom level has its own pre-rendered set of image tiles. Using tiles makes maps faster, scalable, and more lightweight to load.
Slippy Map Tiling. Image: Carl Sack, CCbySA, via Wikimedia Commons
Raster Tile
Raster tiles are the traditional model of tiling a map. Before vector tiles, almost every web map you used was built on raster tiles. When you open any web map, you are usually seeing thousands of small image tiles stitched together. A raster tile is:
- A small image (PNG or JPEG)
- Usually 256 × 256 pixels
- Pre-rendered on a server
- Styled before it reaches you
It is not data.
It is a picture of data.
How Raster Tiles Are Generated
The process typically works like this: Raw data (e.g., OSM database) → a cartographic style at the server → Map is rendered as images → Images are sliced into tiles for each zoom level → Tiles are stored and served via URL → Your browser/application loads the required tiles for the requested zoom level → You are receiving a finished map product.
The raster tiles became so popular as they solved early web mapping problems:
- Speed: Pre-rendered images load very fast.
- Scalability: Servers don’t need to render maps on the fly for each user.
- Simplicity: A tile is just an image URL:
/z/x/y.png. Even lightweight web apps can load them. - Consistent Cartography: Everyone sees the same map style.
For early web mapping, this was revolutionary.
Limitations of Raster Tiles
Raster tiles are static and cannot be styled dynamically. You cannot change road colours, remove labels, hide buildings, filter features, access attributes, query features, modify styling dynamically etc. Because all you have is pixels. It’s like receiving a printed map in the mail. You can look at it. You cannot redesign it.
In this workflow of traditional tiling creation, if you want
- You want a different style → You render new tiles
- You want updated data → You regenerate tiles
- You want analysis → You download raw data separeris creates rdundency:
- One system for visualization (tiles)
- Another system for analysis (downloaded data)
Raster tiles separate visualization from data access. That separation is the key tension.
Vector Tile
Raster tiles solved the problem of rendering and made it faster and lighter.
If tiles are already divided neatly into spatial chunks. What if those tiles contained:
Roads as lines, Buildings as polygons, POIs as points, Attributes intact
Instead of pixels?
This question led to the development of vector tiles.
A vector tile is a small, square chunk of geographic data that contains vector features (points, lines, polygons) and attributes instead of pre-rendered images. All packed into small, zoom-based tiles. The tiling concept remains the same. What changes is what is inside the tile. Think of it like this:
- Raster tile → a screenshot of a map (just pixels)
- Vector tile → the actual map data (roads, buildings, landuse) packed into small tiles.
Most commonly, vector tiles follow the Mapbox Vector Tile (MVT) specification. Instead of .png, the tile is usually delivered as a compressed .pbf file. So instead of URL: /z/x/y.png, you get:/z/x/y.pbf. But this .pbf contains structured geometry - not pixels. While other vector tile encodings exist, the MVT specification became dominant due to its efficiency, open documentation, and widespread adoption across both open-source and commercial GIS platforms. Today, it serves as the foundation for most modern vector tile services.
How Vector Tiles Are Generated
The workflow looks like this: Raw geospatial database (e.g., OSM) → Data is sliced into zoom-based tiles → Each tile stores vector geosetries clipped to its boundary → Tiles are compressed → Styling is applied on the client side (browser, QGIS, etc.)
The crucial shift is “Rendering happens on your machine, not pre-rendered on the server”
Vector Tiles in Modern GIS Era
Vector tiles align with:
- Cloud-native GIS
- API-driven systems
- Lightweight applications
- Streaming data architectures
Instead of:
Download → Store → Style
The new model becomes:
Stream → Style → Publish
This is the major workflow shift we achieved with vector tiles. This is why they are powerful in tools like QGIS.
Same Tile Pyramid, Different Content
Vector tiles still follow the same zoom pyramid logic:
- Zoom 0 → Generalised geometries
- Higher zoom → More detailed geometries
- Even higher zoom → Full detail
But the difference is that at each zoom level can store generalised versions of geometry, optimised for performance. That means:
- Fewer vertices at low zoom
- More detail at high zoom
- Efficient transmissio
- Smooth rendering
What Makes Vector Tiles P,owerful?
-
Client-Side Styling: Because the tile contains geometry, you can change road colours, modify line thickness, hide building layers, filter features and change label rules. The data stays the same and the styling becomes dynamic. This is why in QGIS, you can restyle OSM vector tiles completely.
-
Smaller Than Full Downloads: You don’t download the entire country extract, you only stream. The tiles visible in your map window at the zoom level you’re viewing. This reduces the Storage, Bandwidth and Data duplication.
-
Always Up-to-Date: Since tiles are generated from live databases, you don’t need to download new data files, re-import or replace datasets. A refresh will give you the latest version.
-
Unified Data and Visualisation: Unlike raster tiles, vector tiles combine visualisation and data access. You can query attributes, filter features, style differently and build interactive maps. The tile serves both display and data source.
Limitations of Vector Tiles
Vector tiles are not full datasets or solve all the problems. They are optimised for visualisation; in order to achieve this the geometries may be simplified and the topology may not be perfect. Often editing is not ideal for on tiles. Although it has the vectors, there is a limitation for full spatial analysis. They are not replacements for raw datasets. They are optimised delivery systems. The following table illustrates why a vector tile workflow matters
| Traditional Workflow | Vector Tile Workflow |
|---|---|
| Download the full data extract | Stream only needed tiles |
| Store large local files | No heavy local storage |
| Style in QGIS after download | Style dynamically |
| Manual data refresh | Always up-to-date |
Some Tile Services available for use are listed below.
| Provider | Tile Type | Format | Free Tier | Notes |
|---|---|---|---|---|
| OpenStreetMap (Standard Tiles) | Raster | PNG | Yes (usage policy applies) | Community-operated; not for heavy production use |
| OpenStreetMap Foundation (Shortbread v1) | Vector | MVT (.mvt) |
Yes (usage policy applies) | Official OSM vector tiles: vector.openstreetmap.org |
| Mapbox | Vector (Primary), Raster | PBF / PNG | Limited | Highly customizable; style JSON-based |
| MapTiler | Vector & Raster | PBF / PNG | Starter tier | Cloud + self-host options |
| Esri | Raster & Vector | PNG / PBF | Limited (ArcGIS account) | Enterprise-focused services |
| Google Maps | Raster (API-based) | Internal | No | Proprietary; no raw tile URLs |
[Update] : A tutorial is published for custom map creation using OSM vector tiles read it here.
Any comments on the article, let me know @arkarjun or @Medium.