Going Back to Basics
Table of contents:
This article is intended to explain some basics of Geospatial, which many will get confused about and some smart ways to ensure you won’t get confused again.
License: This article is licensed under the Creative Commons Attribution-ShareAlike 4.0 International (CC BY-SA 4.0) license.
Preface
Recently, I was interacting with a junior and saw a print pinned to the desk board with plotted coordinates and axes. Out of curiosity, I asked what it was and the reply came that the person is working on some scripts to plot maps and that the pinned plot helps in identifying the canvas quickly. Somehow the discussion landed up in latitude and longitude, and thus started the confusion, which is what!
When you climb up the career ladder in your career, you often become an expert in complicated things, while you tend to forget or confuse some of the basics. You may forget simple (a+b)2 while innovating on the complex climate forecast models, and that’s quite natural to some extent; machines and software are the reason for this. For example, calculators are the reason for many of our reduced abilities in mental calculations; similarly, with the popularity of mobile phones, nobody remembers many phone numbers.
Latitude and Longitude
Latitude is the imaginary line which runs horizontally on the Earth’s surface. They range from +90° to -90° with the equator at the middle, which is zero degrees. All the latitudes run parallel to the equator. Longitude is the imaginary line which runs vertically on the earth’s surface +180° to -180°, withthe Prime Meridian at the centre, which is zero degrees as well. All the longitudes run parallel to the Prime Meridian.
👨💻 “Hey, Come on! We all know the definition. Or at least any GPTs can give it.”
🧑 “Okay, tell me how you decide the X and Y then ?”
👨💻“Simple, the larger value is X and the lesser value is Y!”
🧑“Well, that’s right when you work within India, or similar regions. But will it always be right? ”
👨💻“Eh.., Then I will plot the points, and with the help of basemap, I can see if it’s falling in the proper place or not, isn’t it simple?”
🧑“Hm… Yea simple. But what if your location is unknown to you? Or when your AOI is located somewhere near the equator and the prime meridian, such as Nigeria? If you interchange the X and Y, it will still fall in the same province most of the time.”
👨💻“Oh ho… These are often confusing and frequently interchanged. How can we eliminate this confusion?”
🧑“The obvious way is to understand the concept well, such that you won’t forget, and the other tip is to have some associations and remember similar to how you learn rule of operations in arithmetic or anything similar. Here it goes for you both ways.”
The Concept Way
On a simple Cartesian X–Y graph, the X-axis is horizontal and the Y-axis is vertical. In geographic coordinates, lines of latitude are horizontal (parallel to the Equator), and lines of longitude are vertical (meridians running from pole to pole). For any vertical line on a graph, the X coordinate is constant; similarly, for any meridian on the globe, the longitude value is constant. For any horizontal line on a graph, the Y coordinate is constant; similarly, for any parallel of latitude, the latitude value is constant. By convention, the X value is written first, followed by the Y value. By convention in GIS and geographic coordinate systems, the first coordinate (X) stores longitude and the second coordinate (Y) stores latitude. So even though lines of latitude are horizontal like the X-axis, their values are stored in the Y position, and even though lines of longitude are vertical like the Y-axis, their values are stored in the X position.
The Mnemonic Way
A mnemonic is any learning technique or memory aid that helps a person remember information by linking it to something easier to recall, like a phrase, rhyme, image, story, or association. For example, we use an acrostic mnemonic - BODMAS to remember the rules of operations in arithmetic. In this case, we can use a visual or an analogy mnemonic. Imagine a door: the long side is vertical, so you can remember that Long itude runs vertically on the globe, and the opposite to it - latitude runs horizontally. In a standard Cartesian graph, we write the X value first and the Y value second. In geographic coordinate systems, the same ordering is used, but the first value (X) stores longitude and the second value (Y) stores latitude. You can think of this as “visually reversed”: the vertical lines (longitude) use the first value (X), and the horizontal lines (latitude) use the second value (Y). While mnemonics are not a substitute for deep conceptual understanding, they are a very useful way to reduce confusion and build a strong starting point for learning.
Recall, Precision, Accuracy, and F1 score
Precision, recall, accuracy, and F1-score are commonly used to represent the performance of data and machine learning models. Although these metrics are not traditionally part of a geospatial professional’s core basics, they are increasingly important foundational knowledge for anyone who works with data in this AI era.
These four terms are all evaluation metrics for classification models, but they answer different questions about model performance. To understand them, let’s start with the basic building block for all these - the Confusion Matrix. As usual, to avoid confusion, let’s call our friend Professor Analogy for help. For any binary classification problem, there are four possible outcomes -
| Predicted Positive | Predicted Negative | |
|---|---|---|
| Actual Positive | True Positive (TP) | False Negative (FN) |
| Actual Negative | False Positive (FP) | True Negative (TN) |
All the other metrics are derived from the above four values.
| Metric | Description | Analogy (Forest vs Non-Forest) |
|---|---|---|
| True Positive (TP) | The value is actually positive and the model predicts positive. | Pixels that are actually forest and the model also predicts them as forest. |
| True Negative (TN) | The value is actually negative and the model predicts negative. | Pixels that are actually non-forest and the model also predicts them as non-forest. |
| False Positive (FP) | The value is actually negative but the model predicts positive. | Pixels that are actually non-forest but the model predicts them as forest. |
| False Negative (FN) | The value is actually positive but the model predicts negative. | Pixels that are actually forest but the model predicts them as non-forest. |
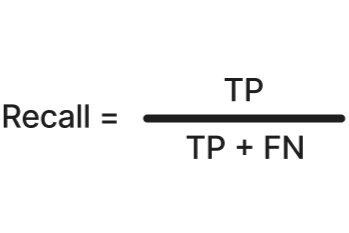
Recall
Recall answers the question: out of all the positives in the universe, how many did the model catch? In our older analogy, in a given AOI, recall tells you: out of all the forest areas, how many did the model correctly identify as forest. Recall is often used in applications where sensitivity is important, such as fraud detection or disease screening, because missing a positive case is costly. High recall means the model misses very few actual positives and has good coverage of the positive class.
Formula:
Precision
Precision answers the question: when a model says something is positive, how often is it right? In our forest analogy, in a given AOI, precision tells you: out of all the areas the model predicted as forest, how many are actually forest. Precision is often used in applications where the purity of positive predictions is important, such as spam detection (do not mark important mail as spam) or medical tests, where too many false alarms cause unnecessary panic and cost. High precision means the model raises very few false alarms (few false positives) and the predicted positive set is very “clean”.
Formula:

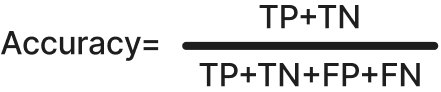
Accuracy
Accuracy answers the question: overall, how often is the model correct? In our forest analogy, in a given AOI, accuracy tells you what fraction of all pixels (forest and non‑forest) the model classified correctly. Accuracy is most useful when the class distribution is roughly even and the cost of missing positives and raising false alarms is similar, because it counts all correct and incorrect predictions equally. On highly imbalanced datasets, however, accuracy can be misleading, since a model that mostly predicts the majority class can still achieve a high accuracy. High accuracy means that most predictions, both positive and negative, are correct.
Formula:
F1 Score
F1 score answers the question: how well does the model balance being correct when it predicts positive (precision) with catching as many real positives as possible (recall)? In our forest analogy, in a given AOI, the F1 score summarises, in a single number, how well the model both avoids false forest areas (precision) and avoids missing real forest areas (recall). It is useful when classes are imbalanced or when both kinds of errors are important, missing real positives and raising false alarms, because it punishes models that do well on only one of precision or recall. F1 score is the harmonic mean of precision and recall, so it becomes high only when both are high. A high F1 score means the model achieves a good trade‑off: the predicted values are reasonably “clean,” and most of the true values are found.
Formula:

Unlike accuracy, which looks at all predictions and can appear high just because the majority class is easy to guess, F1 focuses only on the positive class and directly reflects the balance between precision and recall, making it much more reliable when classes are imbalanced or positives are rare.
| Metric | Product / Decision Question It Helps Answer | What Decision It Informs | Example Product or Workflow Scenario |
|---|---|---|---|
| Recall | “Are we missing anything important?” | Whether the system is safe to rely on for coverage-critical decisions | Flood extent mapping: Are we detecting all flooded areas before relief planning?Disease outbreak detection: Are we catching all potential cases early? |
| Precision | “Can users trust each positive result?” | Whether outputs are reliable enough for action without manual verification | Disaster alert systems: Should authorities act immediately on this alert?Fraud detection: Can analysts directly block flagged transactions? |
| Accuracy | “Is the system generally correct?” | Whether the system is acceptable for overall reporting or monitoring | Land-use statistics for annual reportsCrop classification summaries where classes are balanced |
| F1 Score | “Is the system making a good trade-off between misses and false alarms?” | Whether the model is production-ready when both risks matter | Damage assessment products used by insurersEO-based decision support platforms used by governments |
To conclude, lets summarises it as Recall protects against blind spots, Precision protects user trust, Accuracy satisfies reporting, and F1 keeps the system honest.
I don’t want to stretch the article. If there are any more concepts which you think need to be simplified or any comments on the article, let me know @arkarjun or @Medium.