2024 Discoveries and Beginnings
Table of contents:
In this blog I talk about certain tech and new words which I came across or started working with in 2024.
License: This article is licensed under the Creative Commons Attribution-ShareAlike 4.0 International (CC BY-SA 4.0) license.
Preface
When the new year raises its curtain it’s always good to look back and have a reflection on the past and learn from it. This article is all about the NEW things I came across in 2024, generally with technology. Everything which I mention here may not be new to the industry or me; sometimes it simply means that I started working with it more closely or in depth. Although I started writing it in Jan first week, it took a while for me to complete. As it says better late than never here is the blog.
Concepts
1. CI/CD
Continuous Integration and Continuous Delivery/Deployment (CI/CD) is the concept of software development practice that automates the process of integrating code changes, testing them, and delivering them to production environments rapidly and reliably, streamlining the software release lifecycle. Whats differs in CI/CD from normal method is automated testing is triggered as and when the new code is merged and the code passes the test it gets deployed to production. So it is very important to have a well written test cases. This ensures that the deployment to the production doesnot breaks the application. Read more about CI/CD here
2. KTLO
KTLO is another acronym any company wants to minimise. It stands for Keep The Lights On. It refers to all the routine activities such as monitoring, maintenance, support etc. to make the system run. Operational efficiency and automation depends on how low are the resources utilised for KTLO without any downtime of system and services. While KTLO is a necessity, excessive time and resources spent on it can slow down the actual innovation. The aim is to balance KTLO work vs. new feature development by automating maintenance tasks, routine checks or optimizing workflows.
3. YES-Tech
For the past five years, a major portion of my professional experience was on agri remote sensing generating insights for various financial institutions, insurance agencies and others in the industry requiring agriculture-related information ,analysing the satellite imagery across the globe. I came across YES-Tech in the same trajectory when the Ministry of Agriculture and family welfare, Government of India conceptualised it under the Pradhan Mantri Fasal Bima Yojana (PMFBY) in 2023.
YES-Tech is the concept of estimation of crop yields through various technologies. YES Tech stands for Yield Estimation System, based on Technology. It advocates for the blended usage of modelled and Crop Cutting Experiment (CCE) estimates of the crop. There are five models mentioned in the YES-TECH manual
- Semi-Physical Model
- AI/ML Model
- Ensemble Model
- Crop Simulation Model
- Parametric index model for crop performance by Crop Health Factor (indirect approach)
Refer to the YES-TECH manual for more details, I may also think of writing a detailed blog on this later some time.
4. Data Warehouse and Data Lake
I am sure that there won’t be anyone who might not know about the database. The geospatial industry is one of the industries which generates petabytes of data daily. When the size of data explodes and new use cases arise, the databases are not capable and feasible to handling them. Hence, newer concepts of storing and retrieving data (not just these two) were introduced to meet the needs and one is not a substitute for the other instead, each adds some specific functionalities.
A Data Warehouse is a structured and centralized storage system designed for fast query performance and business intelligence (BI) reporting. It stores processed and structured data in a predefined schema. A Data Lake is a large, scalable storage system that stores raw, unstructured, semi-structured, and structured data in its native format. It is designed for big data processing and machine learning.
For easy understanding tried to summarise the three into a tabular format
| Feature | Database (OLTP) 🗄️ | Data Warehouse (OLAP) 🏢 | Data Lake (Big Data & AI) 🌊 |
|---|---|---|---|
| Purpose | Stores real-time transactional data | Stores structured and processed data for analytics | Stores raw, structured, and unstructured data for AI/ML |
| Data Type | Structured (tables, rows, columns) | Structured & pre-processed | Structured, semi-structured, and unstructured |
| Schema | Schema-on-Write (structured before storage) | Schema-on-Write (structured before storage) | Schema-on-Read (structured when queried) |
| Processing Type | OLTP (fast read/write, real-time updates) | OLAP (optimized for analytical queries) | Big data processing, AI/ML workflows |
| Storage Format | Relational (SQL-based: MySQL, PostgreSQL) | Optimized relational (Amazon Redshift, Snowflake) | Object storage (Parquet, JSON, video, images) |
| Performance | Fast for real-time transactions | Fast for analytical queries | Slower for queries unless optimized |
| Cost | Moderate | Expensive (high-performance computing) | Cost-effective for large-scale storage |
| Some tools | MySQL, PostgreSQL, MongoDB | Amazon Redshift, Google BigQuery, Snowflake | Amazon S3, Azure Data Lake, Hadoop, Databricks |
Let’s see how these concepts are utilised in a ride-hailing application
| Database (OLTP) 🗄️ | Data Warehouse (OLAP) 🏢 | Data Lake (Big Data & AI) 🌊 | |
|---|---|---|---|
| Use Case | Storing ongoing trips, user profiles, and payments | Analyzing demand trends, peak-hour usage, and driver incentives | Storing raw GPS logs, traffic data, and AI/ML models for route optimization |
| Example Data Stored | Active ride bookings, driver locations, and transaction details | Daily trip count, revenue analysis, and cancellation trends | Raw GPS logs, traffic videos, and app user behaviour logs |
| How It Works Together | Handles live ride bookings and updates | Aggregates trip data for reporting and trend analysis | Stores raw location data and training datasets for AI-powered optimizations |
Technology
1. STAC
STAC stands for Spatial Temporal Asset Catalog is a language or standard for geospatial catalogs and assets. Though STAC is not a new tech for before, 2024 was the period I started working extensively with STAC. The prime focus of this was to bring discoverability to the geospatial data, like satellite imagery, aerial imagery, etc. and enable search on top of this. This stores information (metadata) in a json based format.
As a simple analogy, STAC can be compared to a digital library register where all the books in the library with their metadata (title, author, publisher, year etc.) are recorded. The register can be compared to STAC catalogs, with different sections such as novels, short stories, that can be compared to the STAC collection, and each book is a STAC Item, and a page in it can be STAC Asset.
How does it differ from other catalogs? As STAC is dealing with geospatial data, location and time (ie, spatiotemporal) parameters are of high importance, hence the dimension of the data is higher. Unlike any other catalogs, the searches are on location primarily across multiple time stamps and datasets. One location will have layers of data available over time.
PS: Planning to write a longer one on STAC alone.
2. Workflow Management Platforms
Workflow Management Platforms are systems designed to orchestrate, automate, and monitor workflows in data processing, software development, and AI/ML pipelines. They help streamline complex processes by defining dependencies, scheduling tasks, and ensuring efficient execution. You can consider it as an assembly line of an fully automated factory where the tasks are all organised, scheduled, and triggered as and when the time arises. This is most important to reduce the KTLO and improve CI/CD.
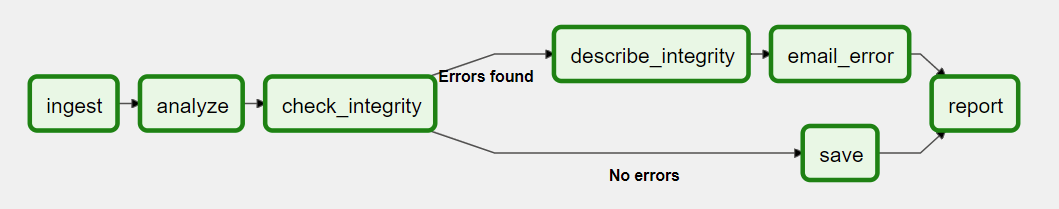
A schematic DAG in Airflow. Source: (https://airflow.apache.org/docs/apache-airflow/2.1.1/concepts/overview.html)
3. Parquet and GeoParquet
Parquet is a column oriented data storage format designed for big data analytics, offering efficient compression, fast querying, and optimized performance compared to traditional row-based formats like CSV or JSON. t is one of the external data formats used by the pandas Python data manipulation and analysis library.
GeoParquet is an extension of Parquet that adds support for geospatial data, enabling efficient storage and querying of location-based datasets in a structured format.
4. Iceberg
Apache Iceberg is a high performance open-source format for large analytic tables. It defines how data is structured and managed in tables like data lake. Like database is a technology that defines how data is stored, managed, or retrieved and we have many tools or implementations like MySQL, PostgreSQL etc. iceberg is a technology that defines how large-scale data tables are structured, managed, and queried efficiently in data lakes.

Tools
1. Airflow
Apache Airflow is an open-source workflow management platform for data engineering pipelines. Workflows are orchestrated using directed acyclic graphs (DAGs). The tasks and their dependencies are defined in Python and then Airflow manages the scheduling and execution. In layman terms Airflow is an free open source software which you can host it on your environment and schedule and sequence tasks for automated workflow management.

2. Valohai
Valohai is a proprietary MLOps (Machine Learning Operations) platform designed to automate the entire lifecycle of an ML project, from data processing and model training to deployment and monitoring. Valohai is framework agnostic ML, which works on-premises (your environment) and can be used with single or multi or hybrid-cloud environments. You can back track the lineage of your ML experiments and it also have automatic versioning enabled. In short Valohai is a kind of workflow management system with special focus on the MLOps part.
3. pygeoapi
pygeoapi is a Geopython project and OSGeo Project. It is a Python server implementation of the OGC API suite of standards
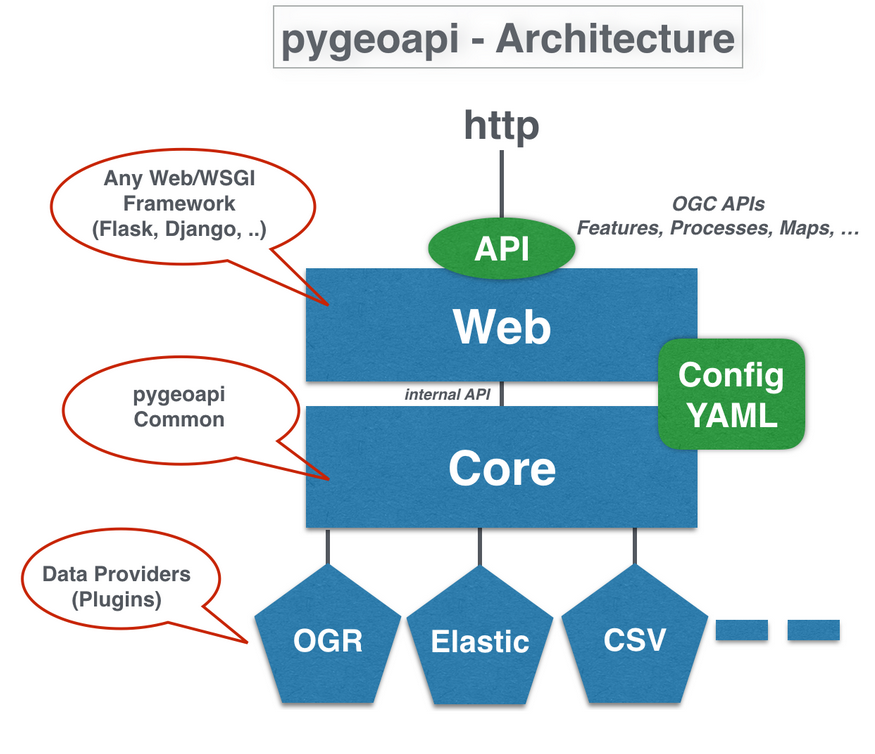
Source: pygeo api presentations (https://pygeoapi.io/presentations/default/#/5/4)
It has a wide range of plugins available for
- Features (Elasticsearch, PostgreSQL/PostGIS, CSV, GeoJSON, OGR, MongoDB, Esri, Azure)
- Coverages (xarray, rasterio)
- Tiles (MinIO, ZXY directory tree)
- Records (Elasticsearch, TinyDB)
- WxS facades / bridges (WMS/WMTS, WFS, CSW)
- and you can built your own too.
4. Penpot
Penpot is an Open Source alternative for figma or Adobe XD. It is a self hosted web based design and prototyping platform embracing total freedom, privacy, control and customization. It supports team collaboration, vector-based design, and interactive prototyping, making it a great choice for organizations and people who prioritize data ownership and open-source software.
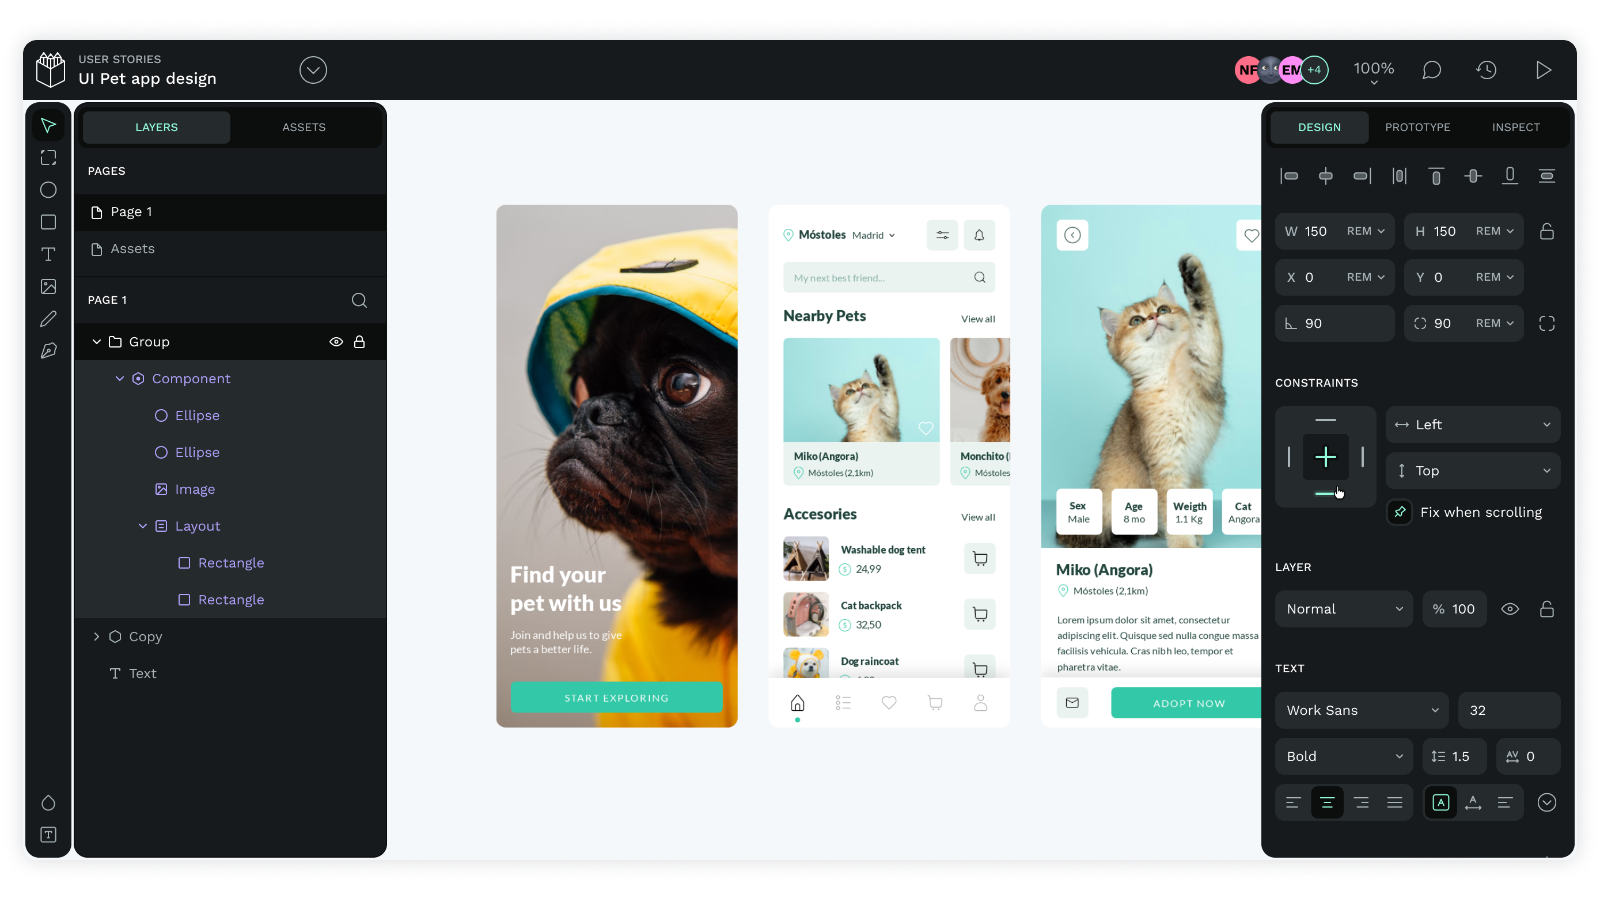
An app design on Penpot’s workspace
I worked with penpot for the SotM Kerala 2024 designs, and found that it the learning curve is almost nill for a figma user.
5. Metabase
Metabase is an Open Source business intelligence (BI) tool which you can connect to a lot of databases. Metabase enables you to ask questions about the data and converts the answers to dashboards for easy interpretations. You can also group many such questions and share the dashboard with people.
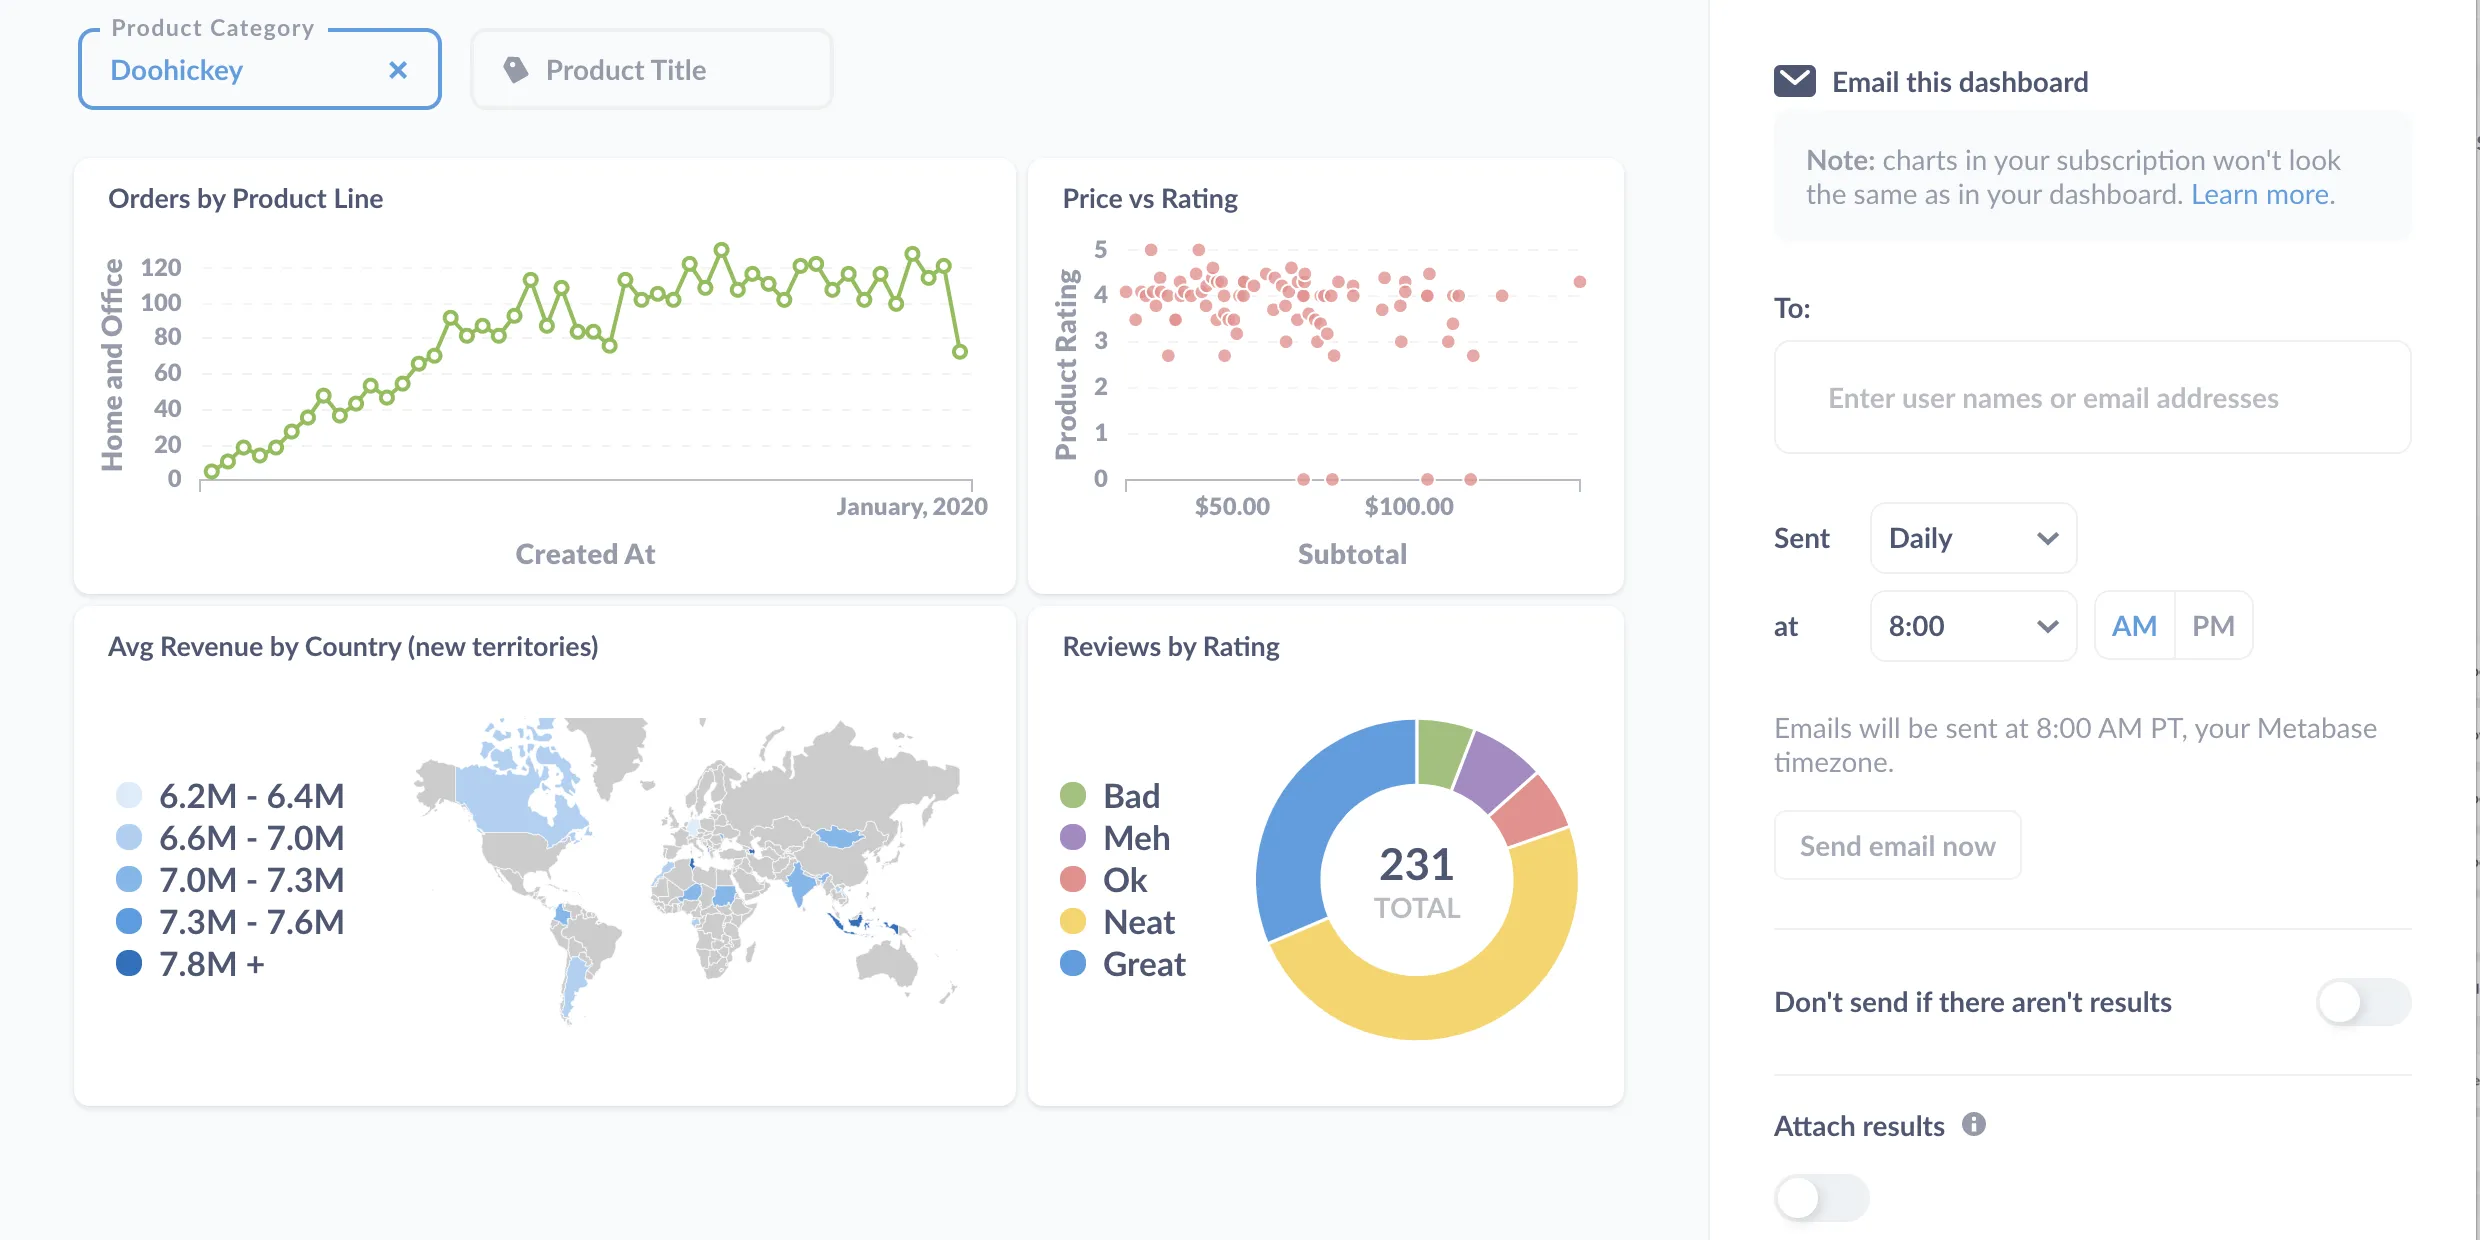
A metabase dashboard. Source: https://www.metabase.com/learn/metabase-basics/overview/tour-of-metabase
6. OSM Inspector
Although its been more than a decade into to the world of open mapping and OSM, this is the first time I used OSM Inspector extensively and found very interesting. It is a visual debugging tool for OpenStreetMap (OSM) data, developed by Geofabrik. It helps validators and data users identify errors, inconsistencies, and quality issues in OSM data through a set of thematic overlays. These overlays highlight potential problems related to geometry, tagging, routing, and administrative boundaries.
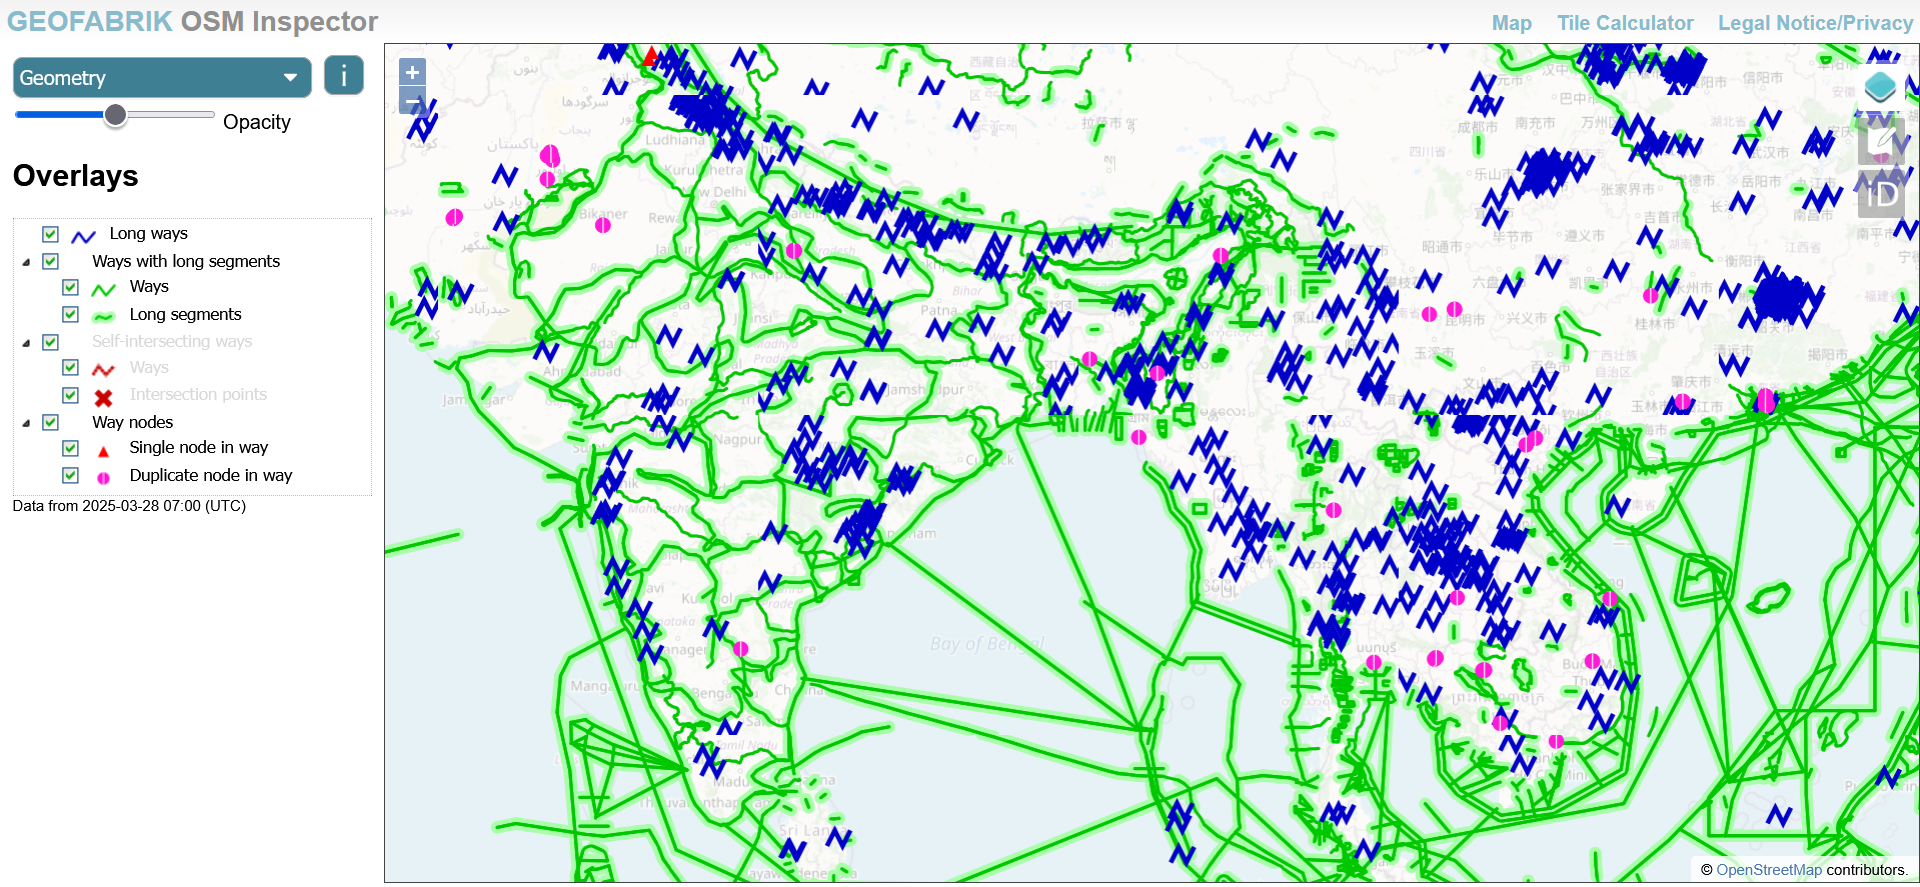
OSM Inspector Interface
There are a bunch of AI tools which came across in last year and I am deliberately not including any of those as you can find it else where.
Any Comments on the article? Let me know @arkarjun or @Medium.