30 Day Map Challenge 2022
Table of contents:
The blog is to showcase and provide some descriptions of the maps I made during the 30 Day Map Challenge 2022.
License: This article and the maps in this are licensed under the Creative Commons Attribution-ShareAlike 4.0 International (CC BY-SA 4.0) license.
30 Day Map Challenge was first proposed by Topi Tjukanov. It is a map making challenge in the month of November - a map a day. People from round the earth make maps and post them on social media with the #30DayMapChallenge hashtag. Like every map enthusiast, I made maps and posted them on my Twitter. The themes of this year’s map challenge were as below:
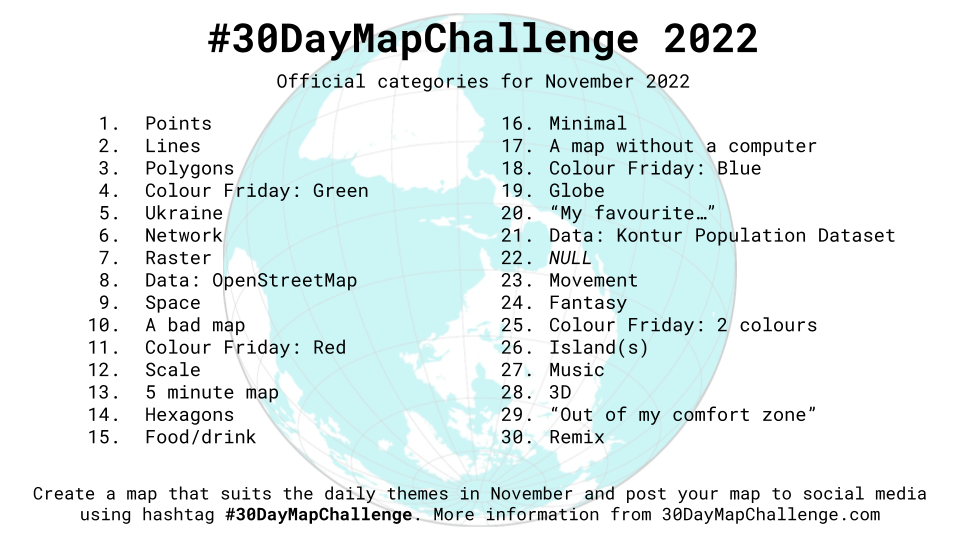
Day 1 - Points
The first day of the challenge, I was travelling back from GeONG and had no access to a computer. How can I miss the first day, what can I do without a computer? Why can’t I make use of this situation and make a map of this? That thought ended up with as map
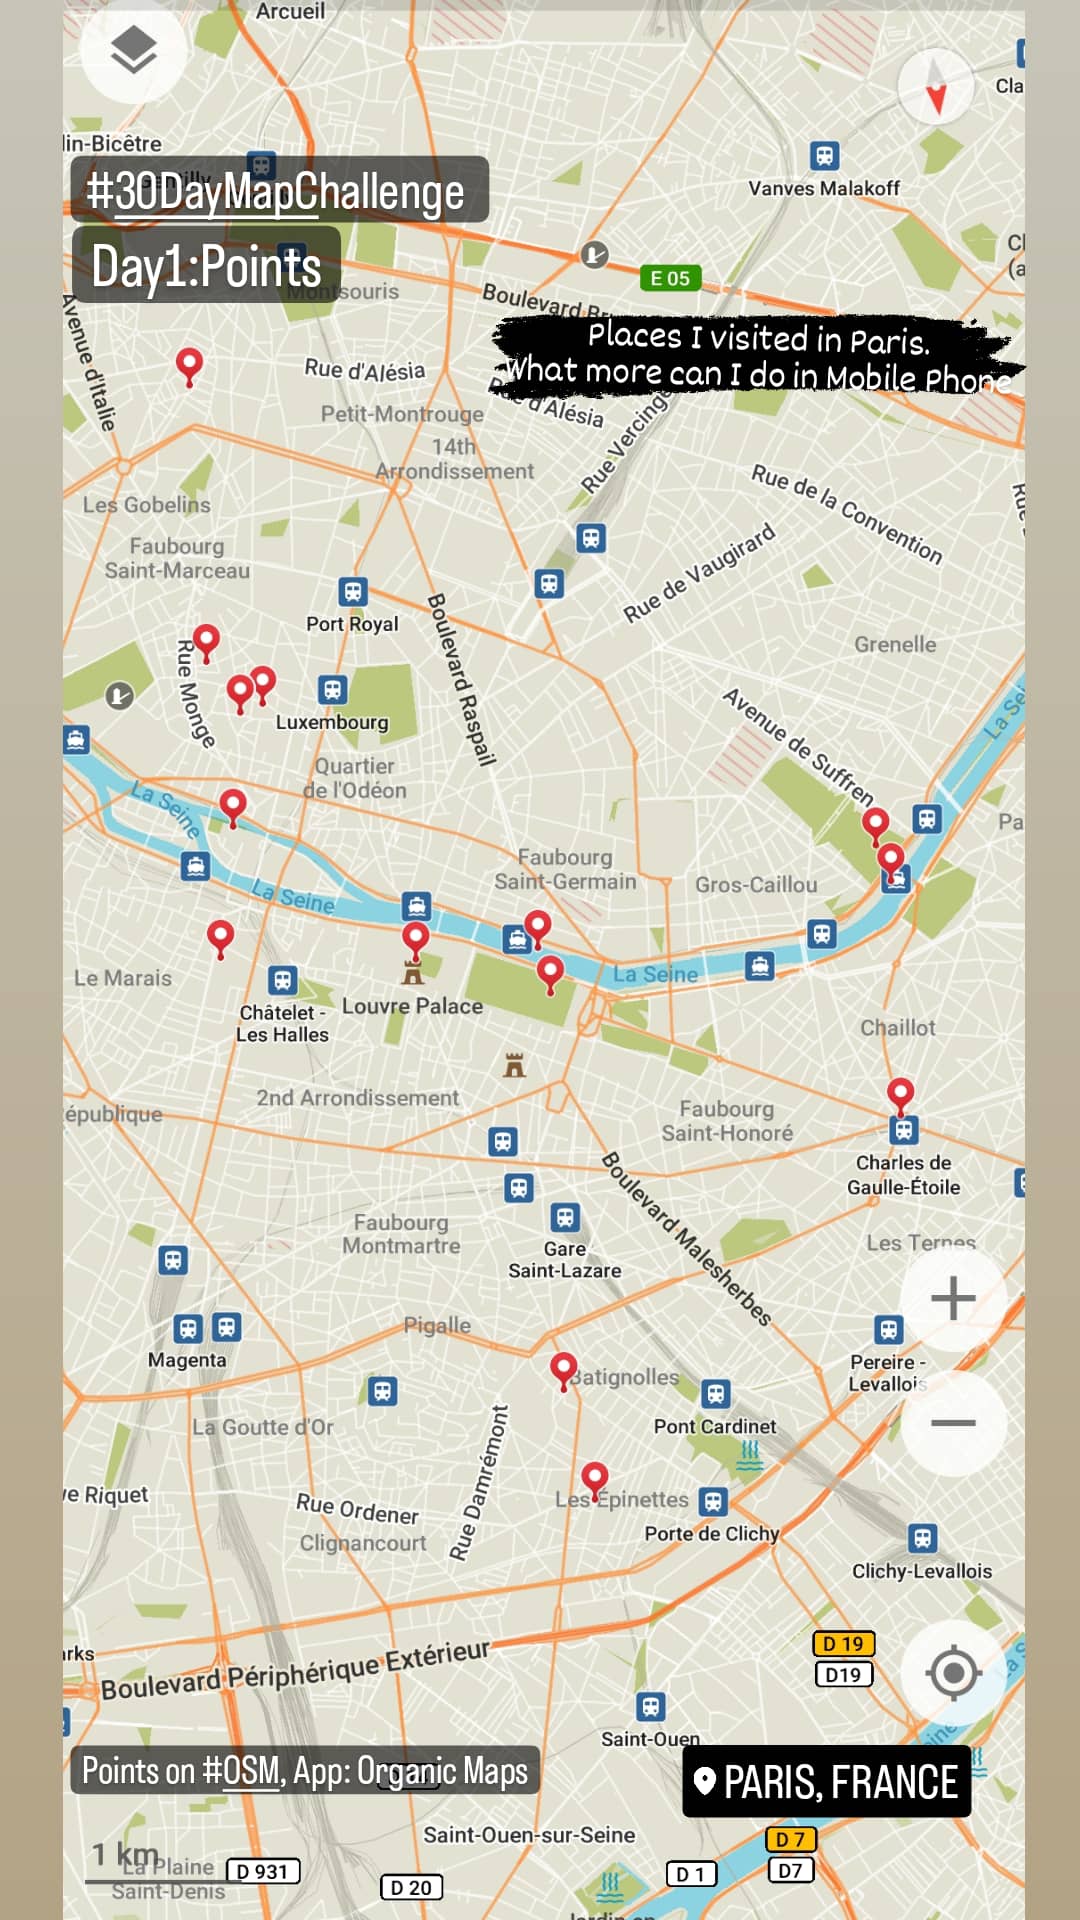
I took my mobile phone, opened Organic Maps and dropped all the locations I visited in Paris during this trip. Thus the screenshot of that became the entry for day 1. A Map was born in the airport transit.
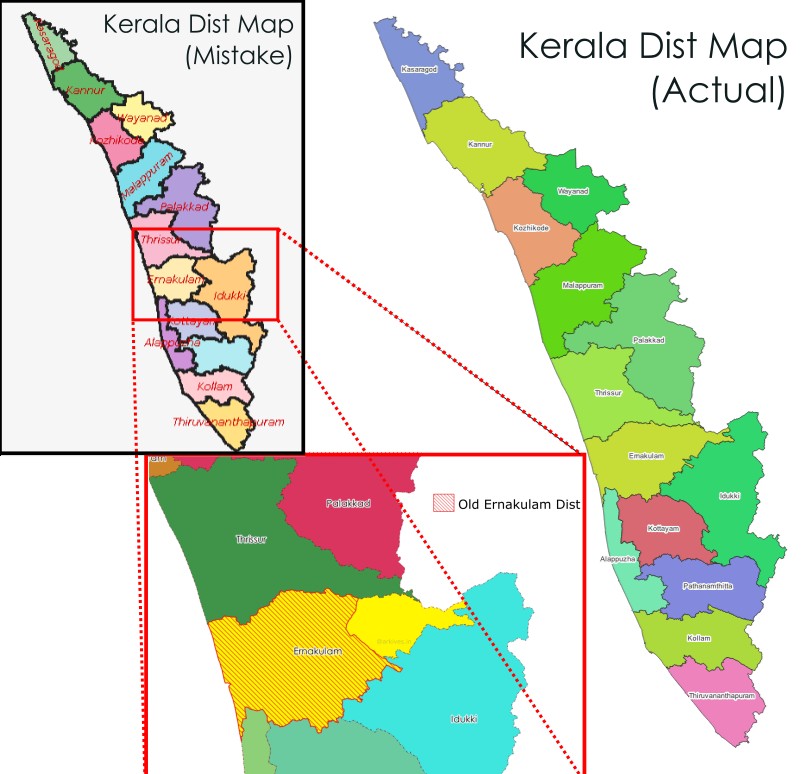
Day 3 - Polygons
Boundaries are the most fascinating Polygons for me. That reminded me of the map hunt campaign നിങ്ങൾക്ക്മാപ്പ് ഇല്ല( Read as: Ningalku Map Illa) for wrong maps. The common mistake in the Kerala map committed even by the government agencies was my entry to day 3.
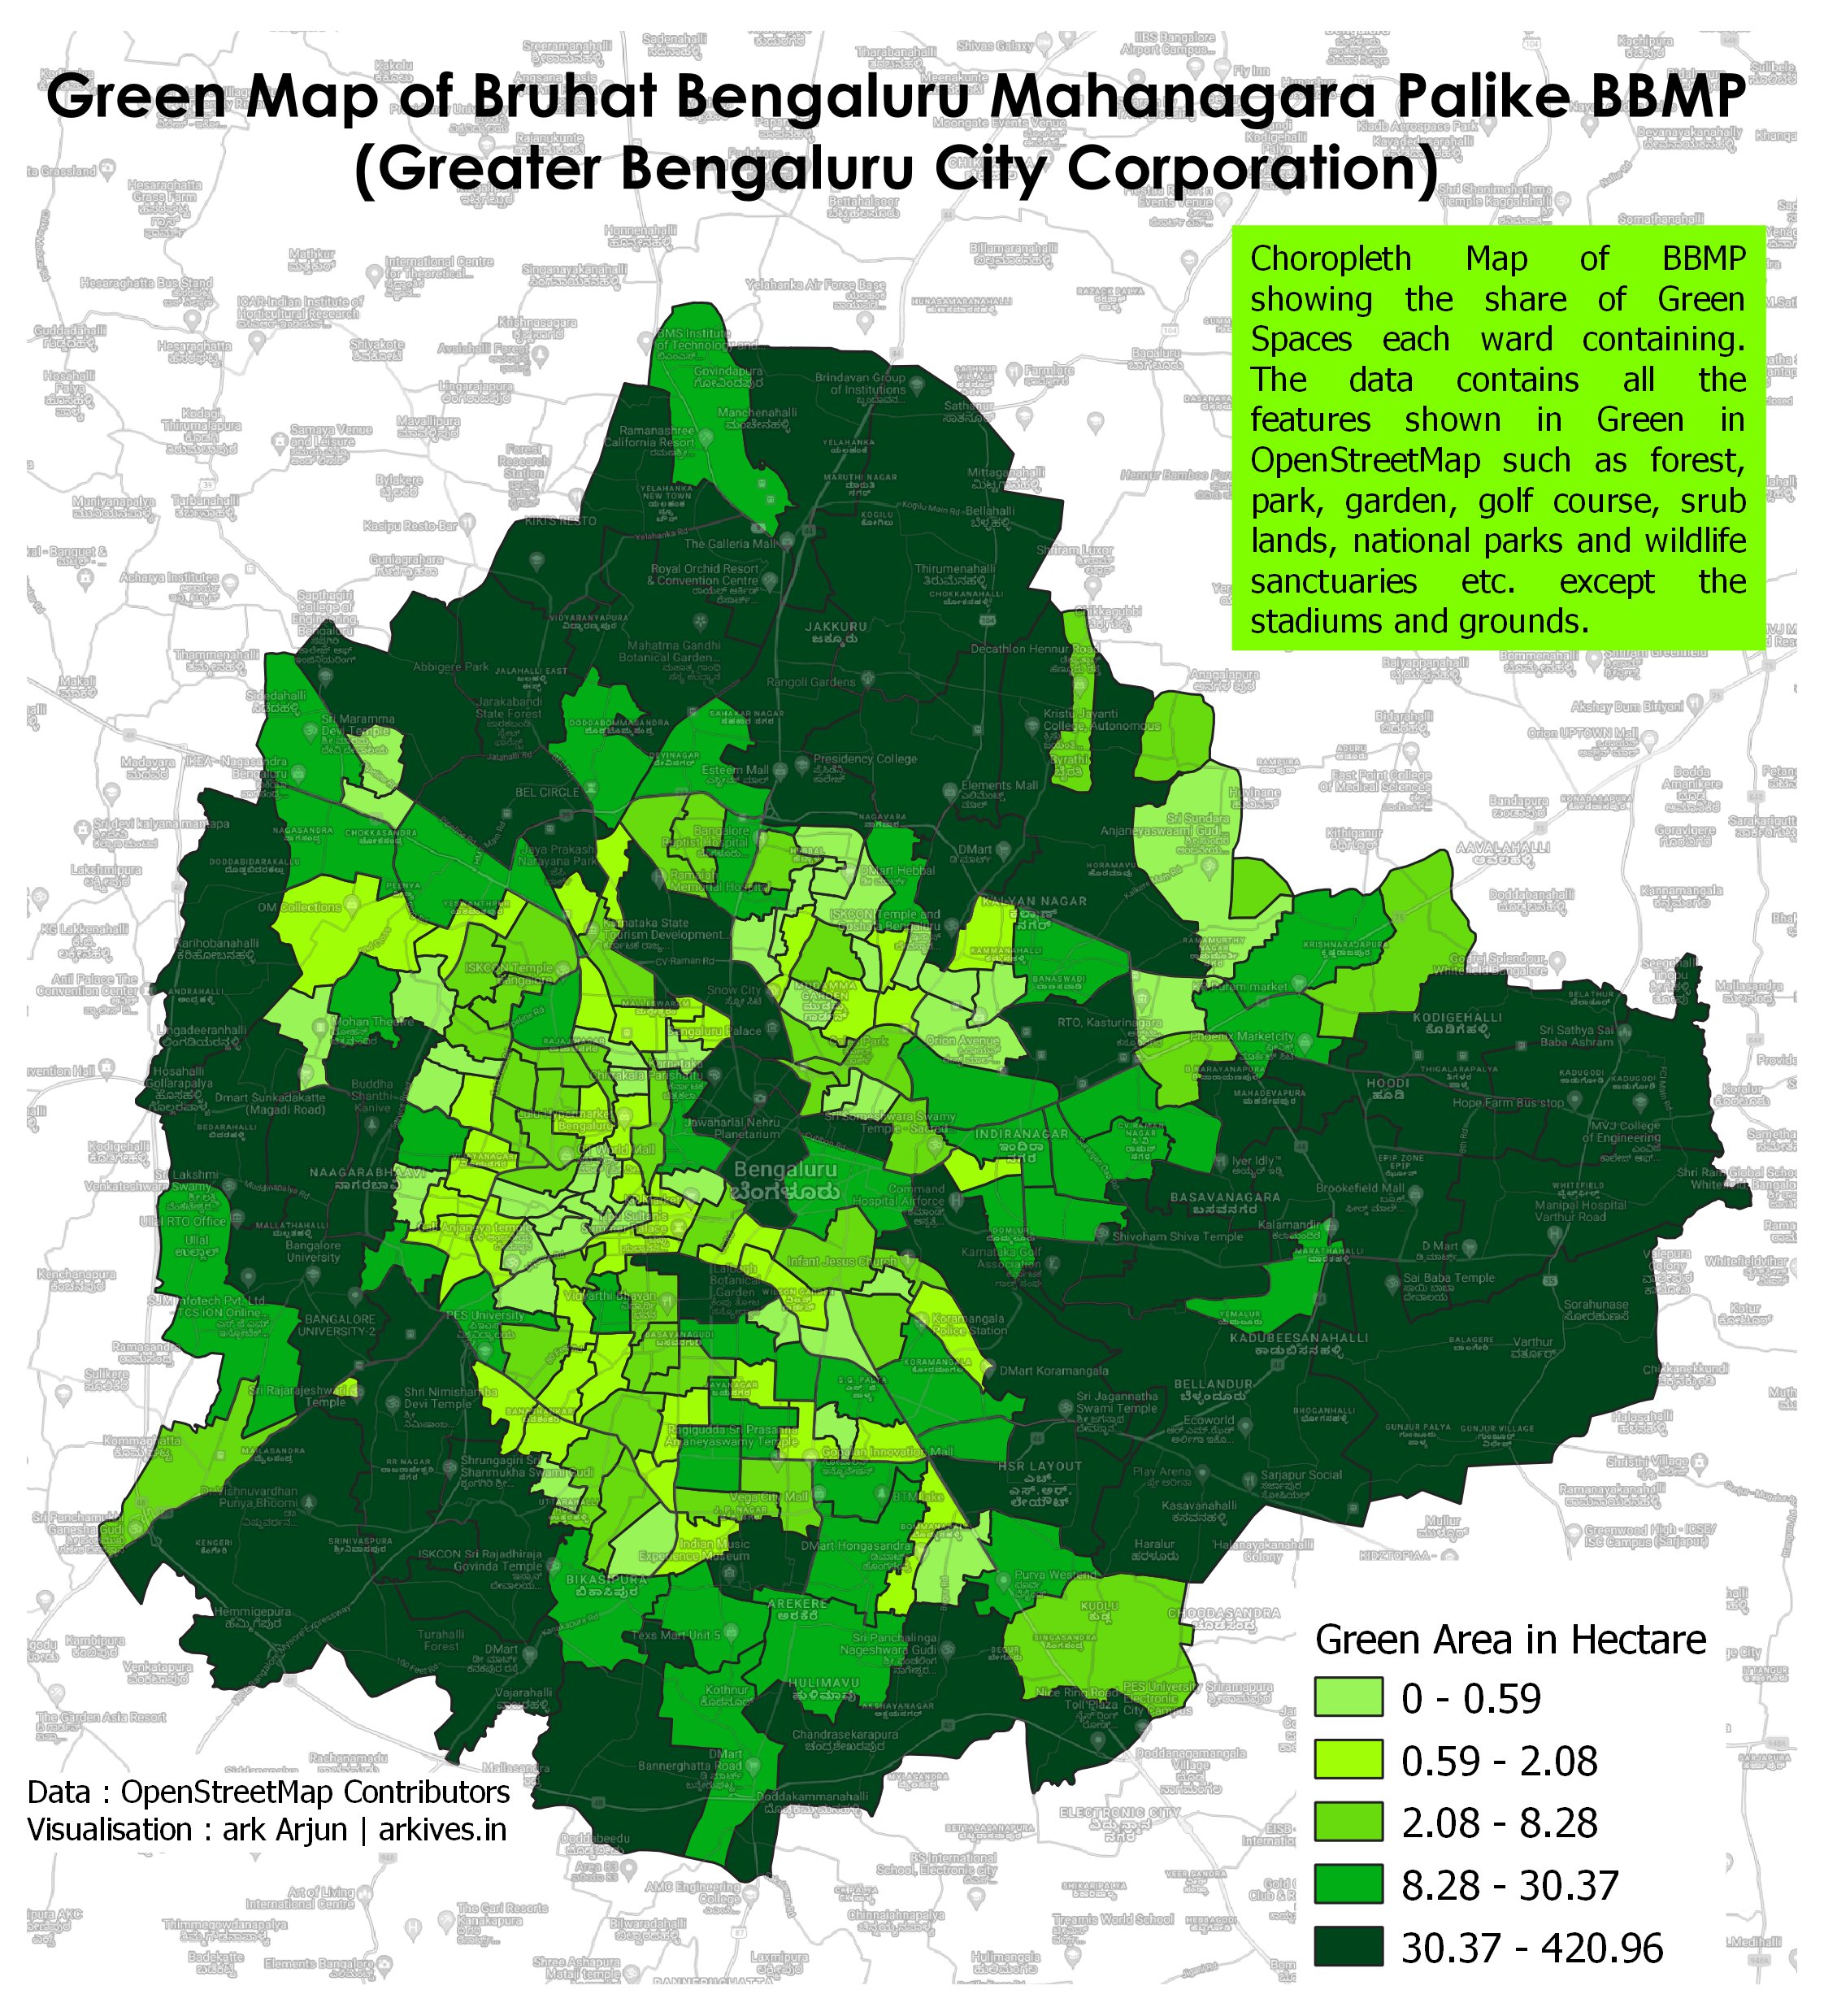
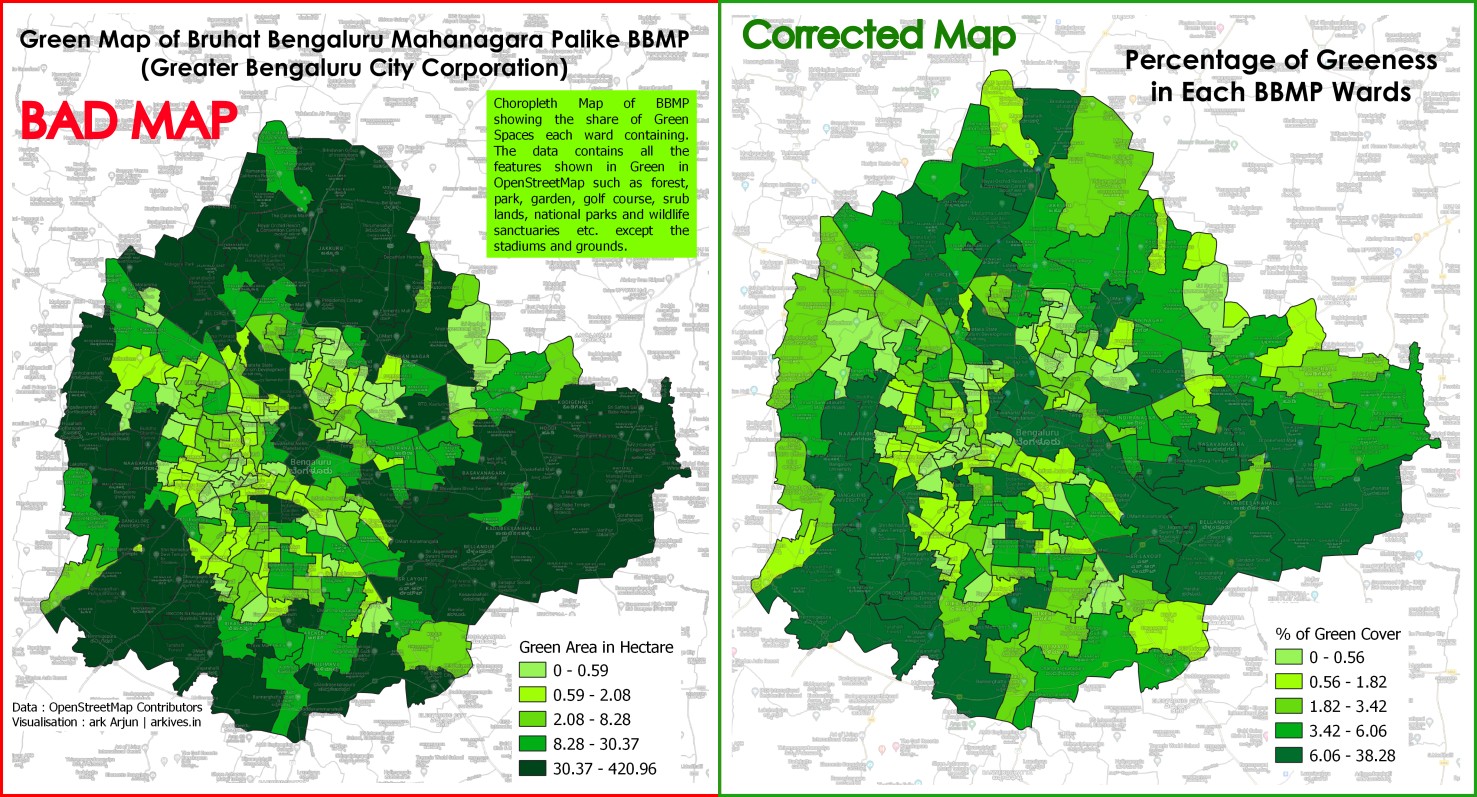
Day 4 - Colour Friday: Green
The theme was to prepare a map containing green colour. The entry of day 4 Colour Friday:Green was a choropleth map of Bruhat Bengaluru Mahanagara Palike (BBMP) showing the share of Green Spaces in each ward of Bengaluru city corporation. The data was the features in OpenStreetMap mapped with the tags forest, parks, garden, shrubs, golf, national parks, wild life sanctuaries etc. except for stadiums and grounds.
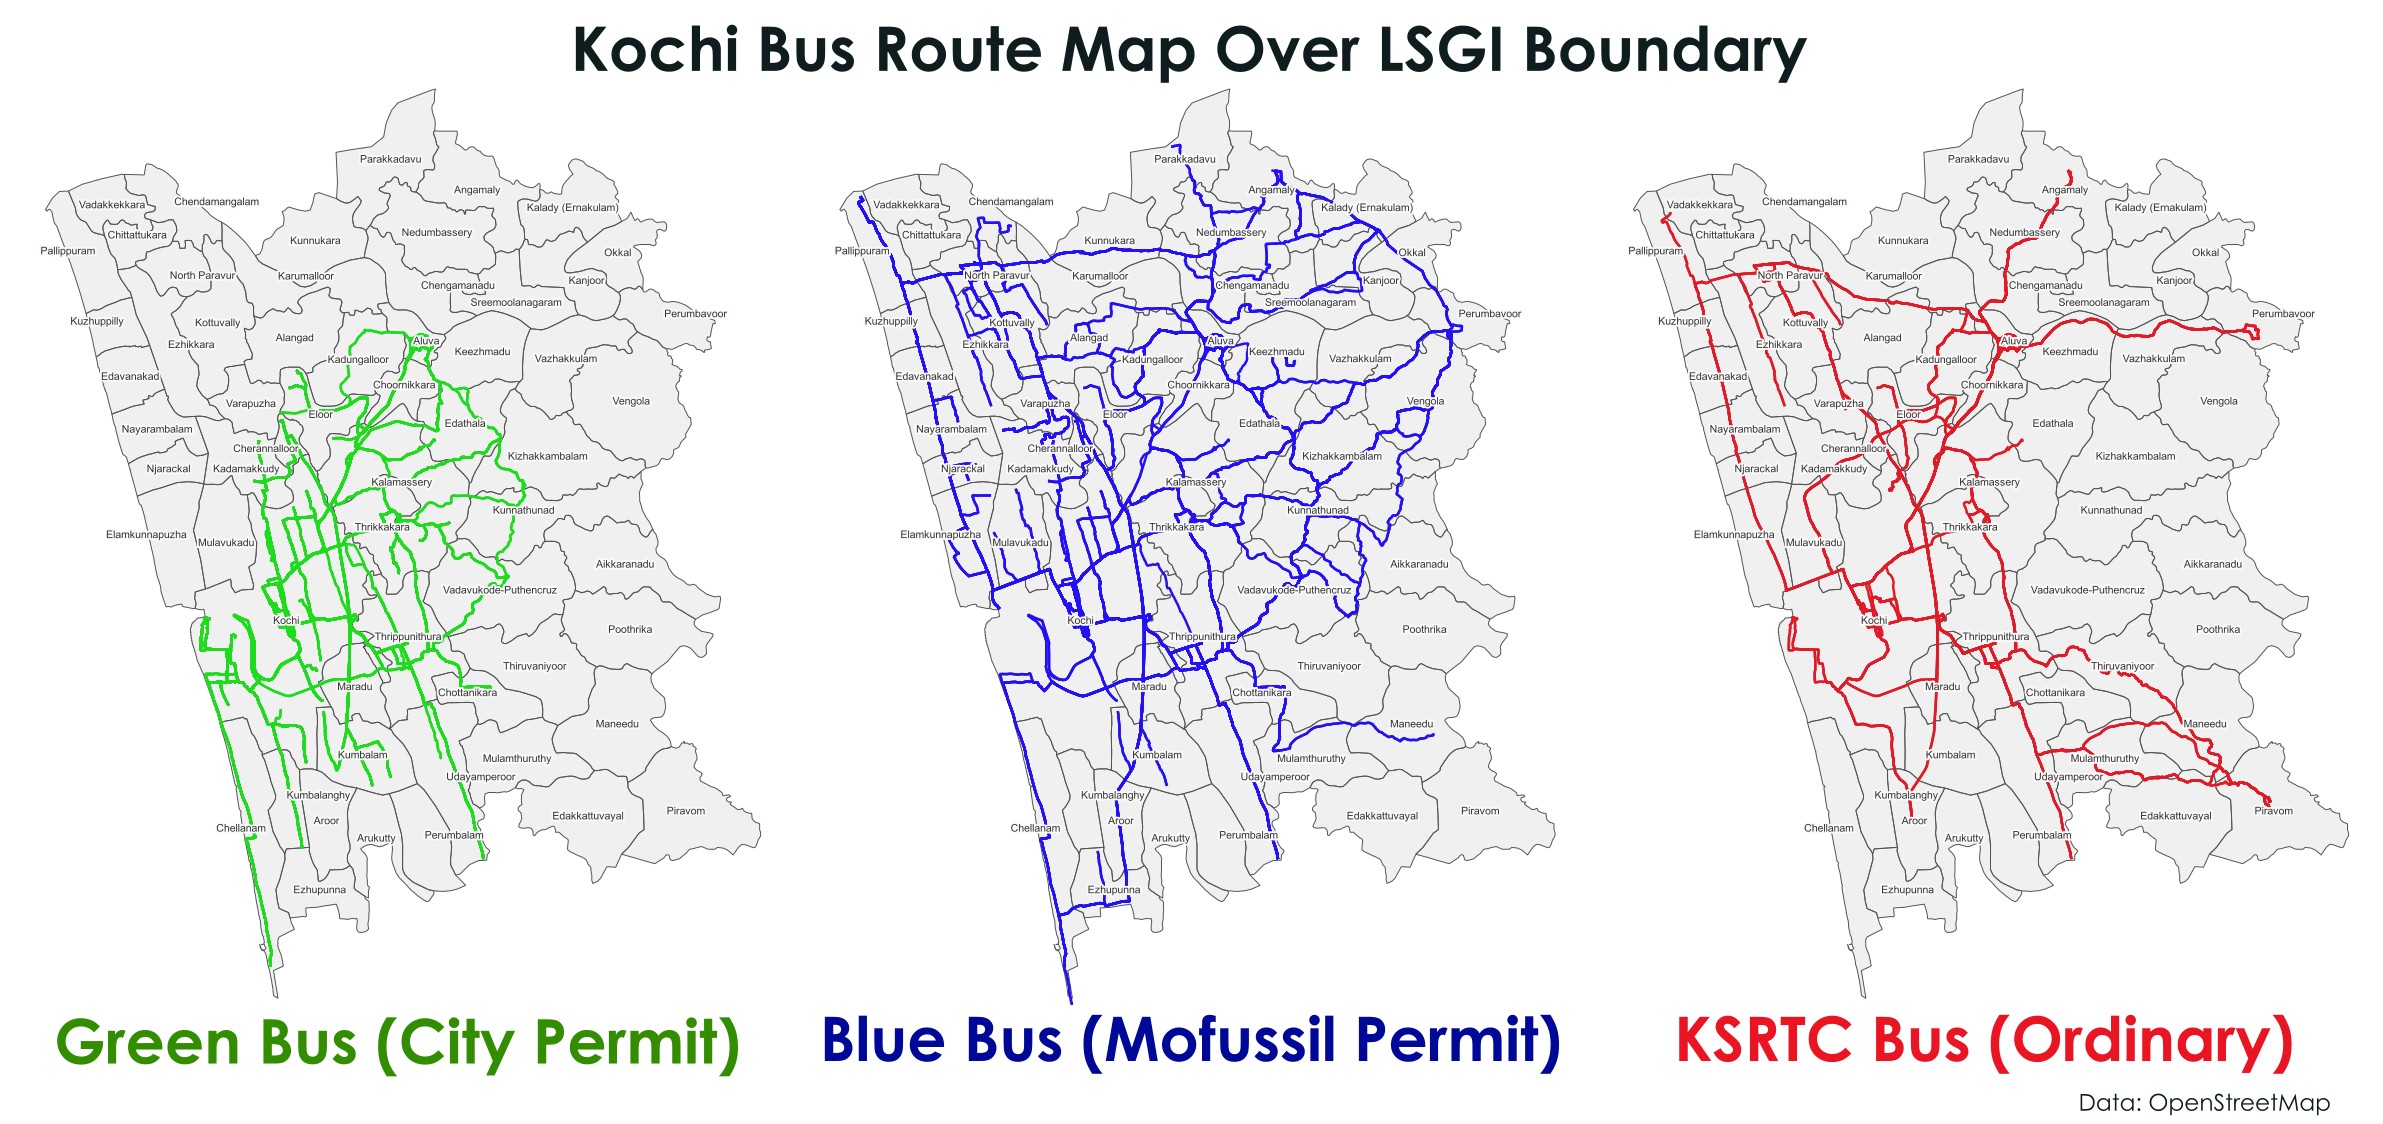
Day 6 - Network
The theme demanded a network of anything. The first thing that came into my mind is the Kochi Bus Route mapping project which we worked on. As part of project, we mapped 25000+Km of transit routes of Kochi and Greater Cochin and over 3000 Bus stops and many more to open data.
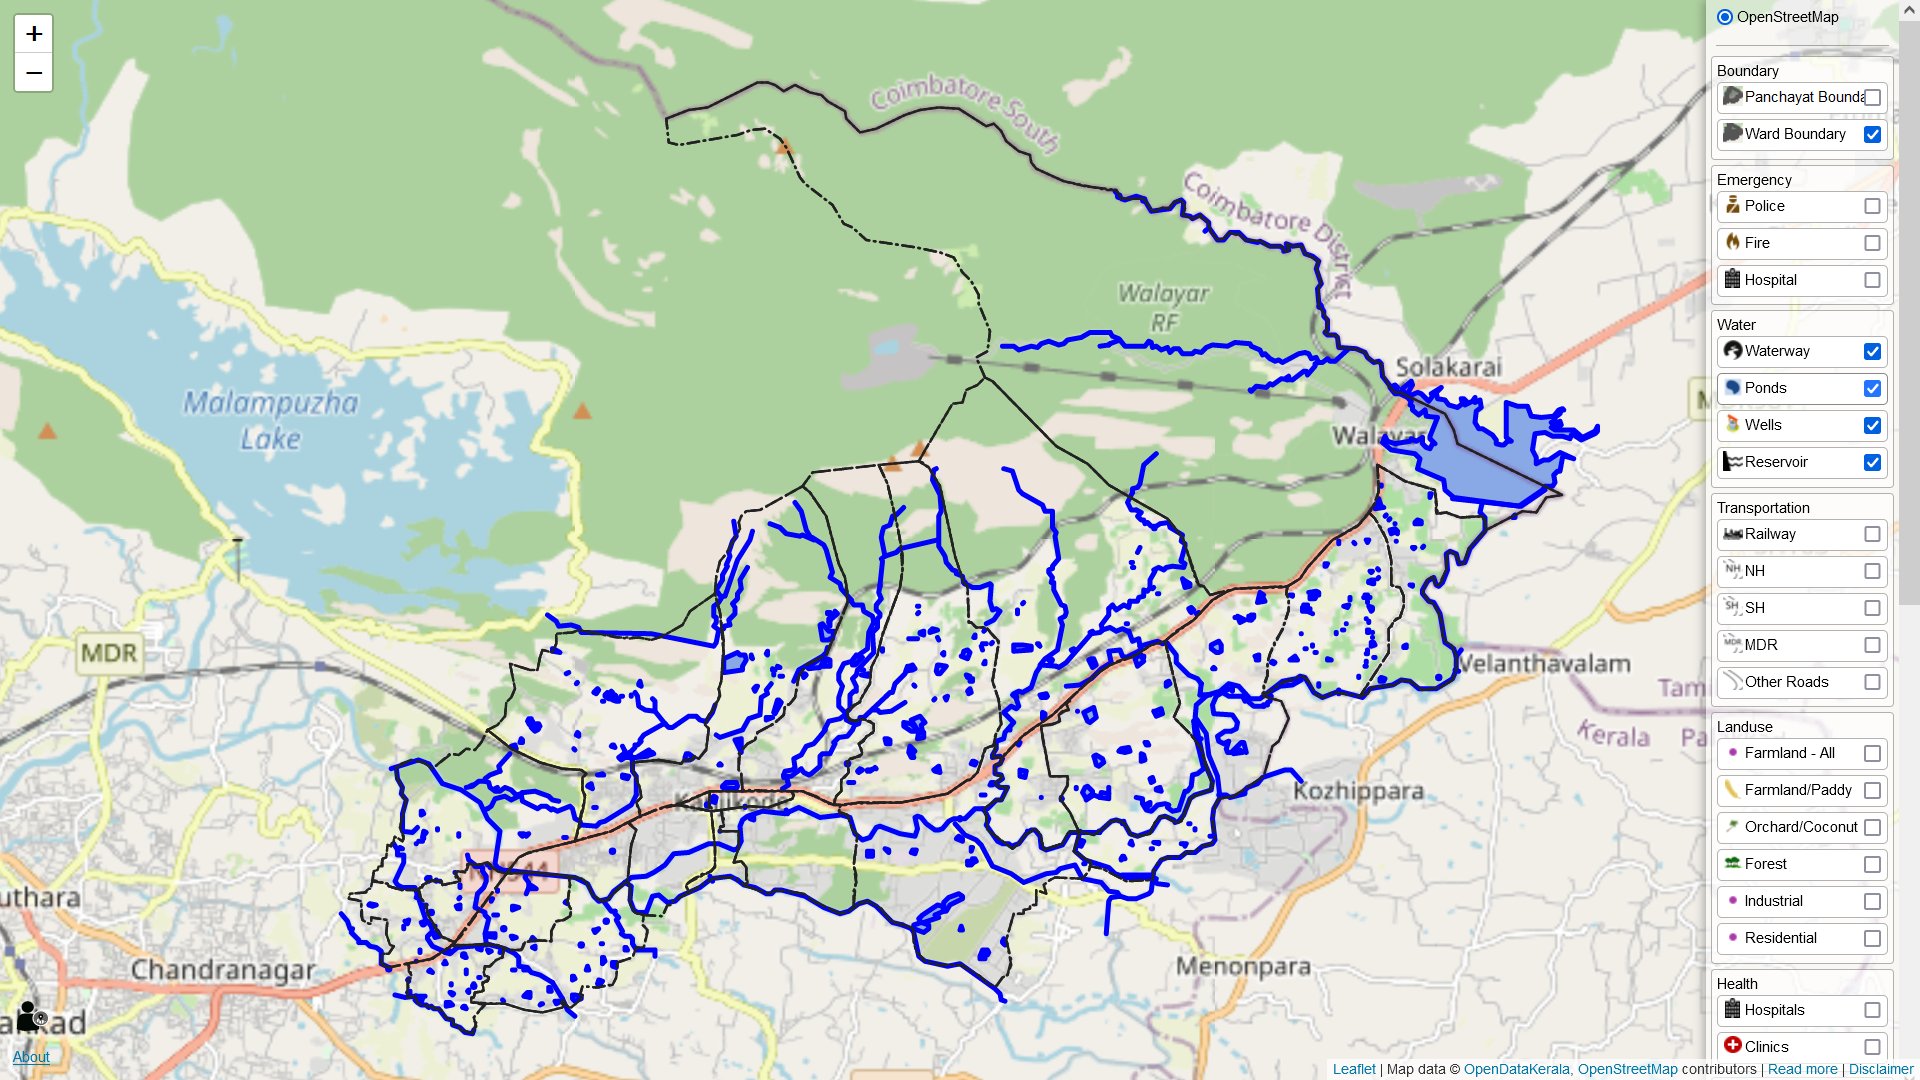
Day 8 - OpenStreetMap
Entry for Day 8’s theme OpenStreetMap was a screenshot of the Open Geospatial Map Data portal of Pudussery Panchayath of Palakkad District. The portal was created by the collective efforts of volunteers of OSM Kerala and Open Data Kerala. Indian Institute of Technology(IIT) Palakkad hosted the volunteers for the preparation of layers and Geominds provided the technical support.
Day 10 - A Bad Map
The theme asks to purposefully make a bad map and explain why it is a bad map. The entry for this is the same map of day 4. You may not find any problem with the first map. But according to me, a good map is one that portrays meaningful insights for actionables. Here simply categorising the wards with areas they are having is not meaningful. It makes wards with larger areas greener and which is not the right method to compare. A percentage map showing the greenness percentage with respect to the total area is the right representation of this data.
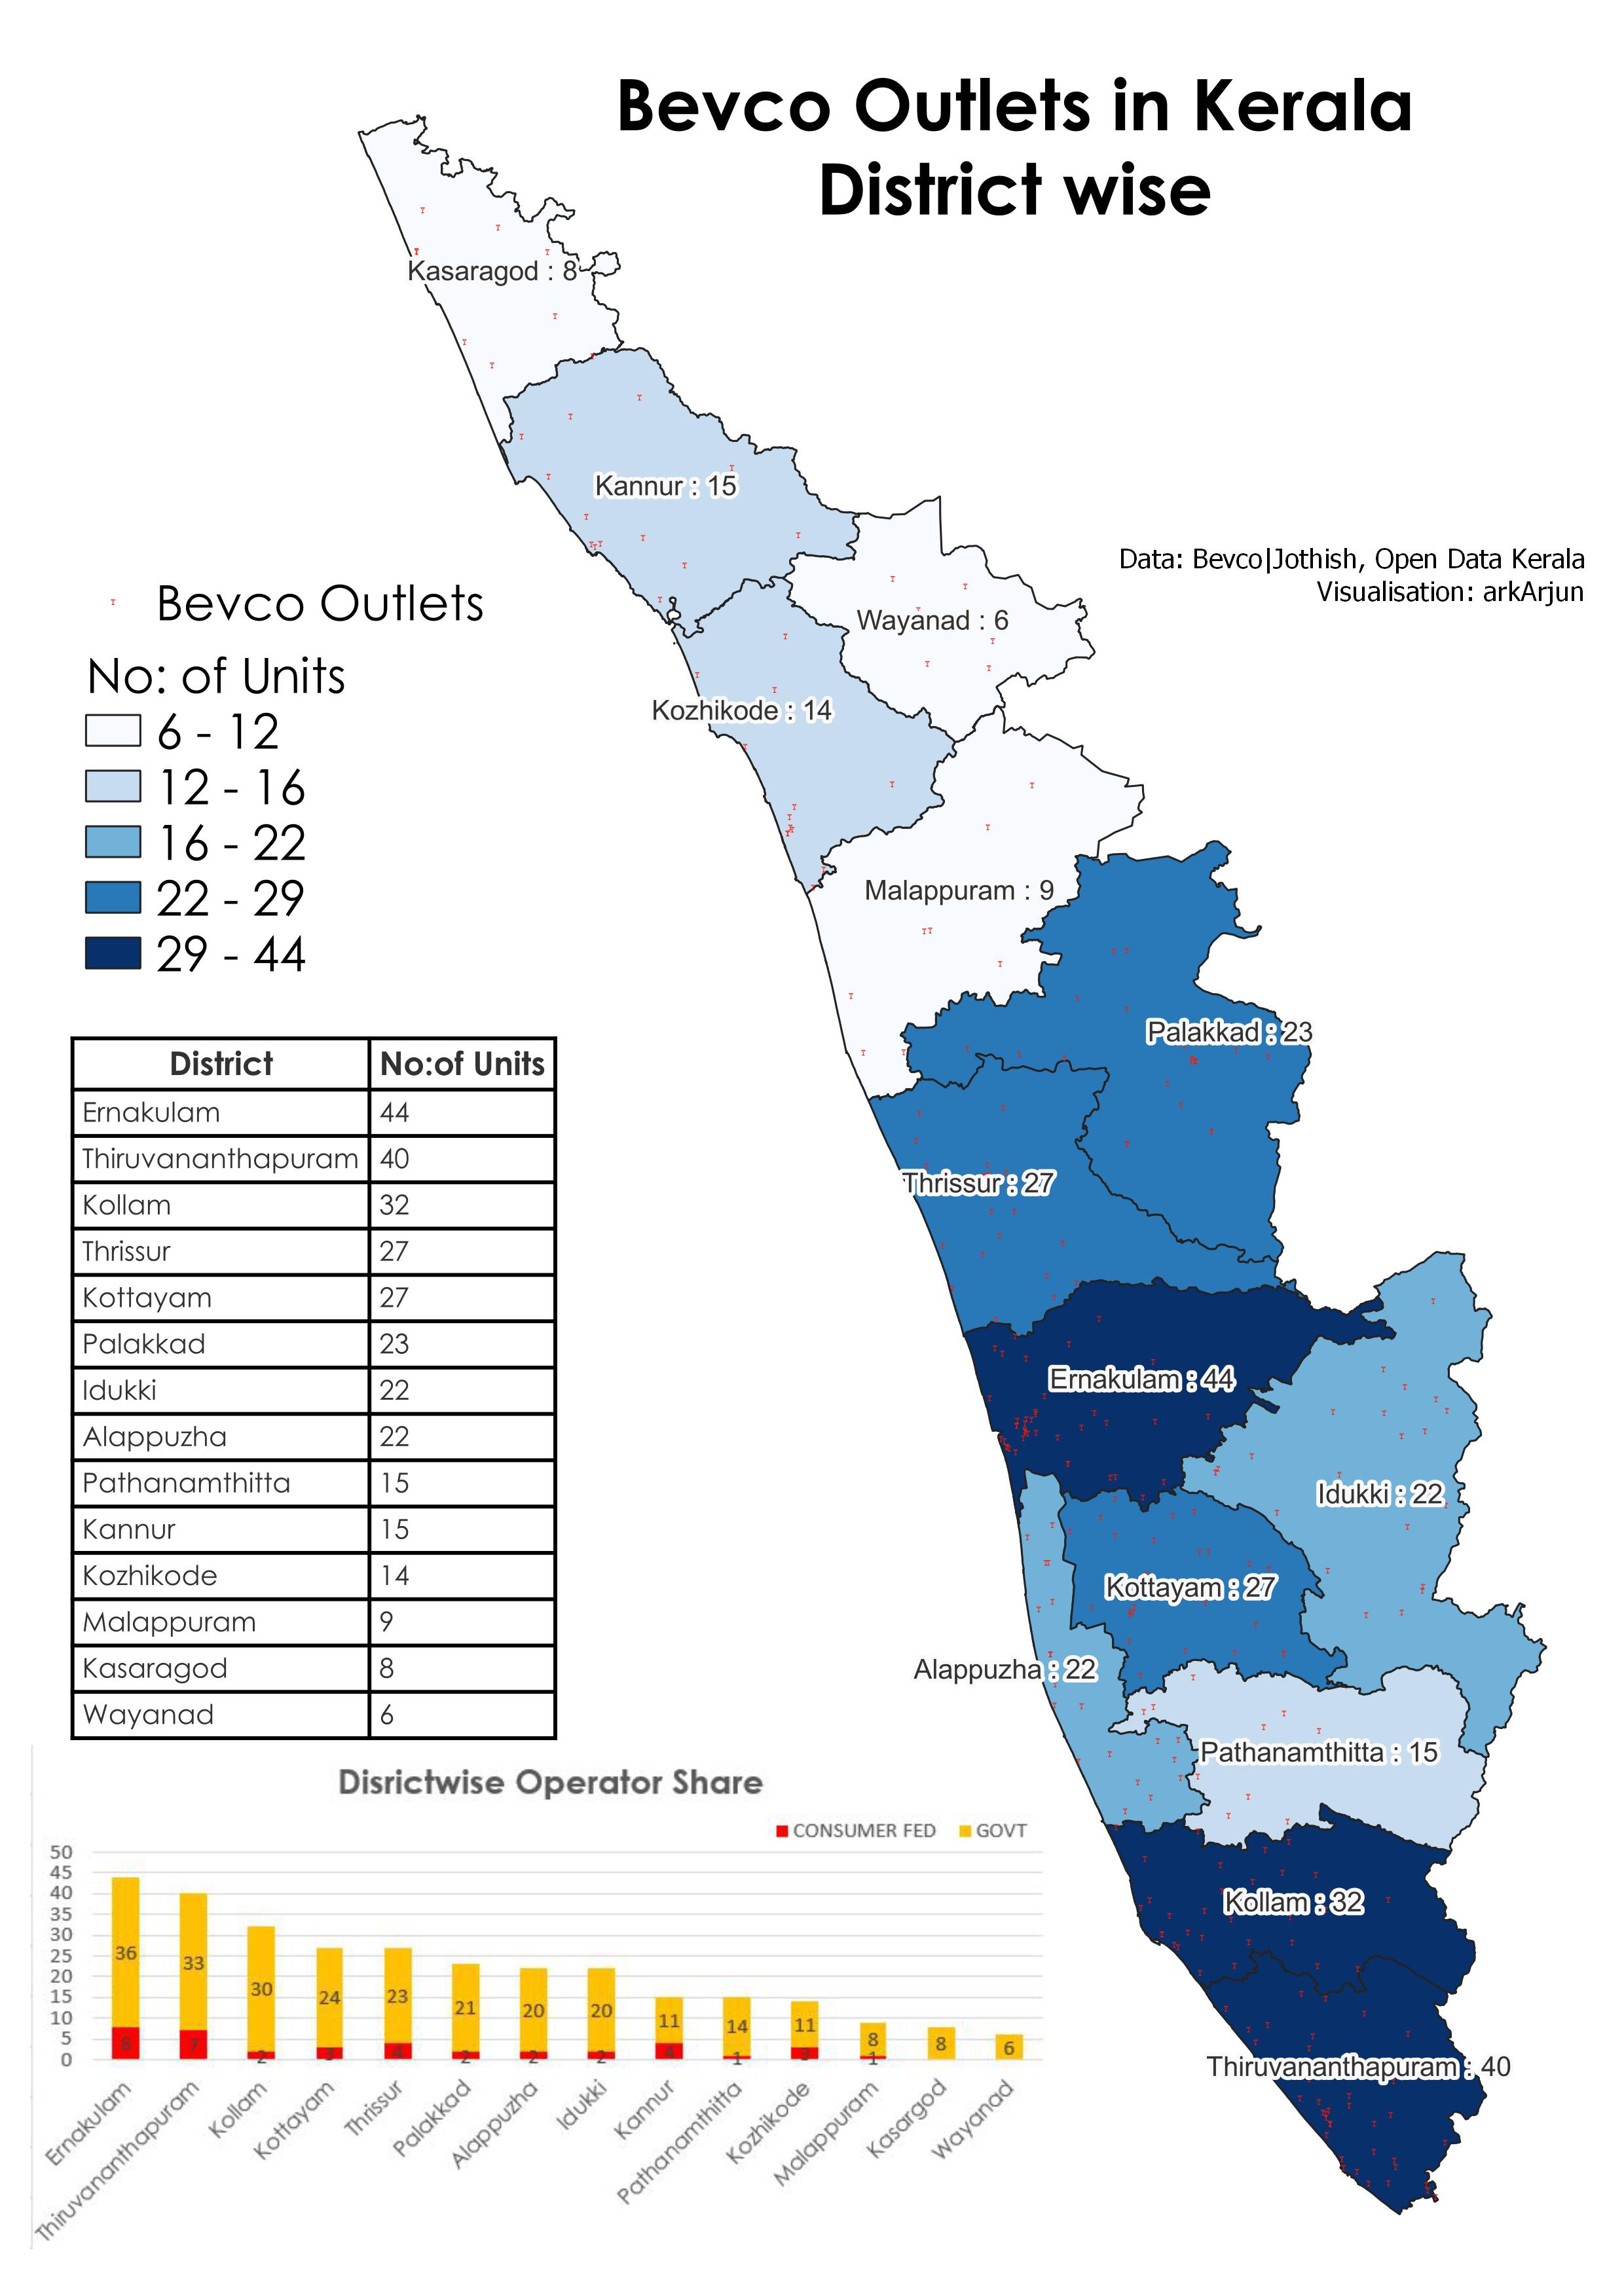
Day 15 - Food/Drink
The map shows the foreign liquor retail shops(not bars) in Kerala. There are only 2 operators in the State - Beverages Corporation owned by the state government(Bevco) and The Kerala State Co-operatives Consumers’ Federation Ltd (Consumerfed), the apex body of the consumer Co-operatives in the state. The maps show the number of outlets per district per operator.
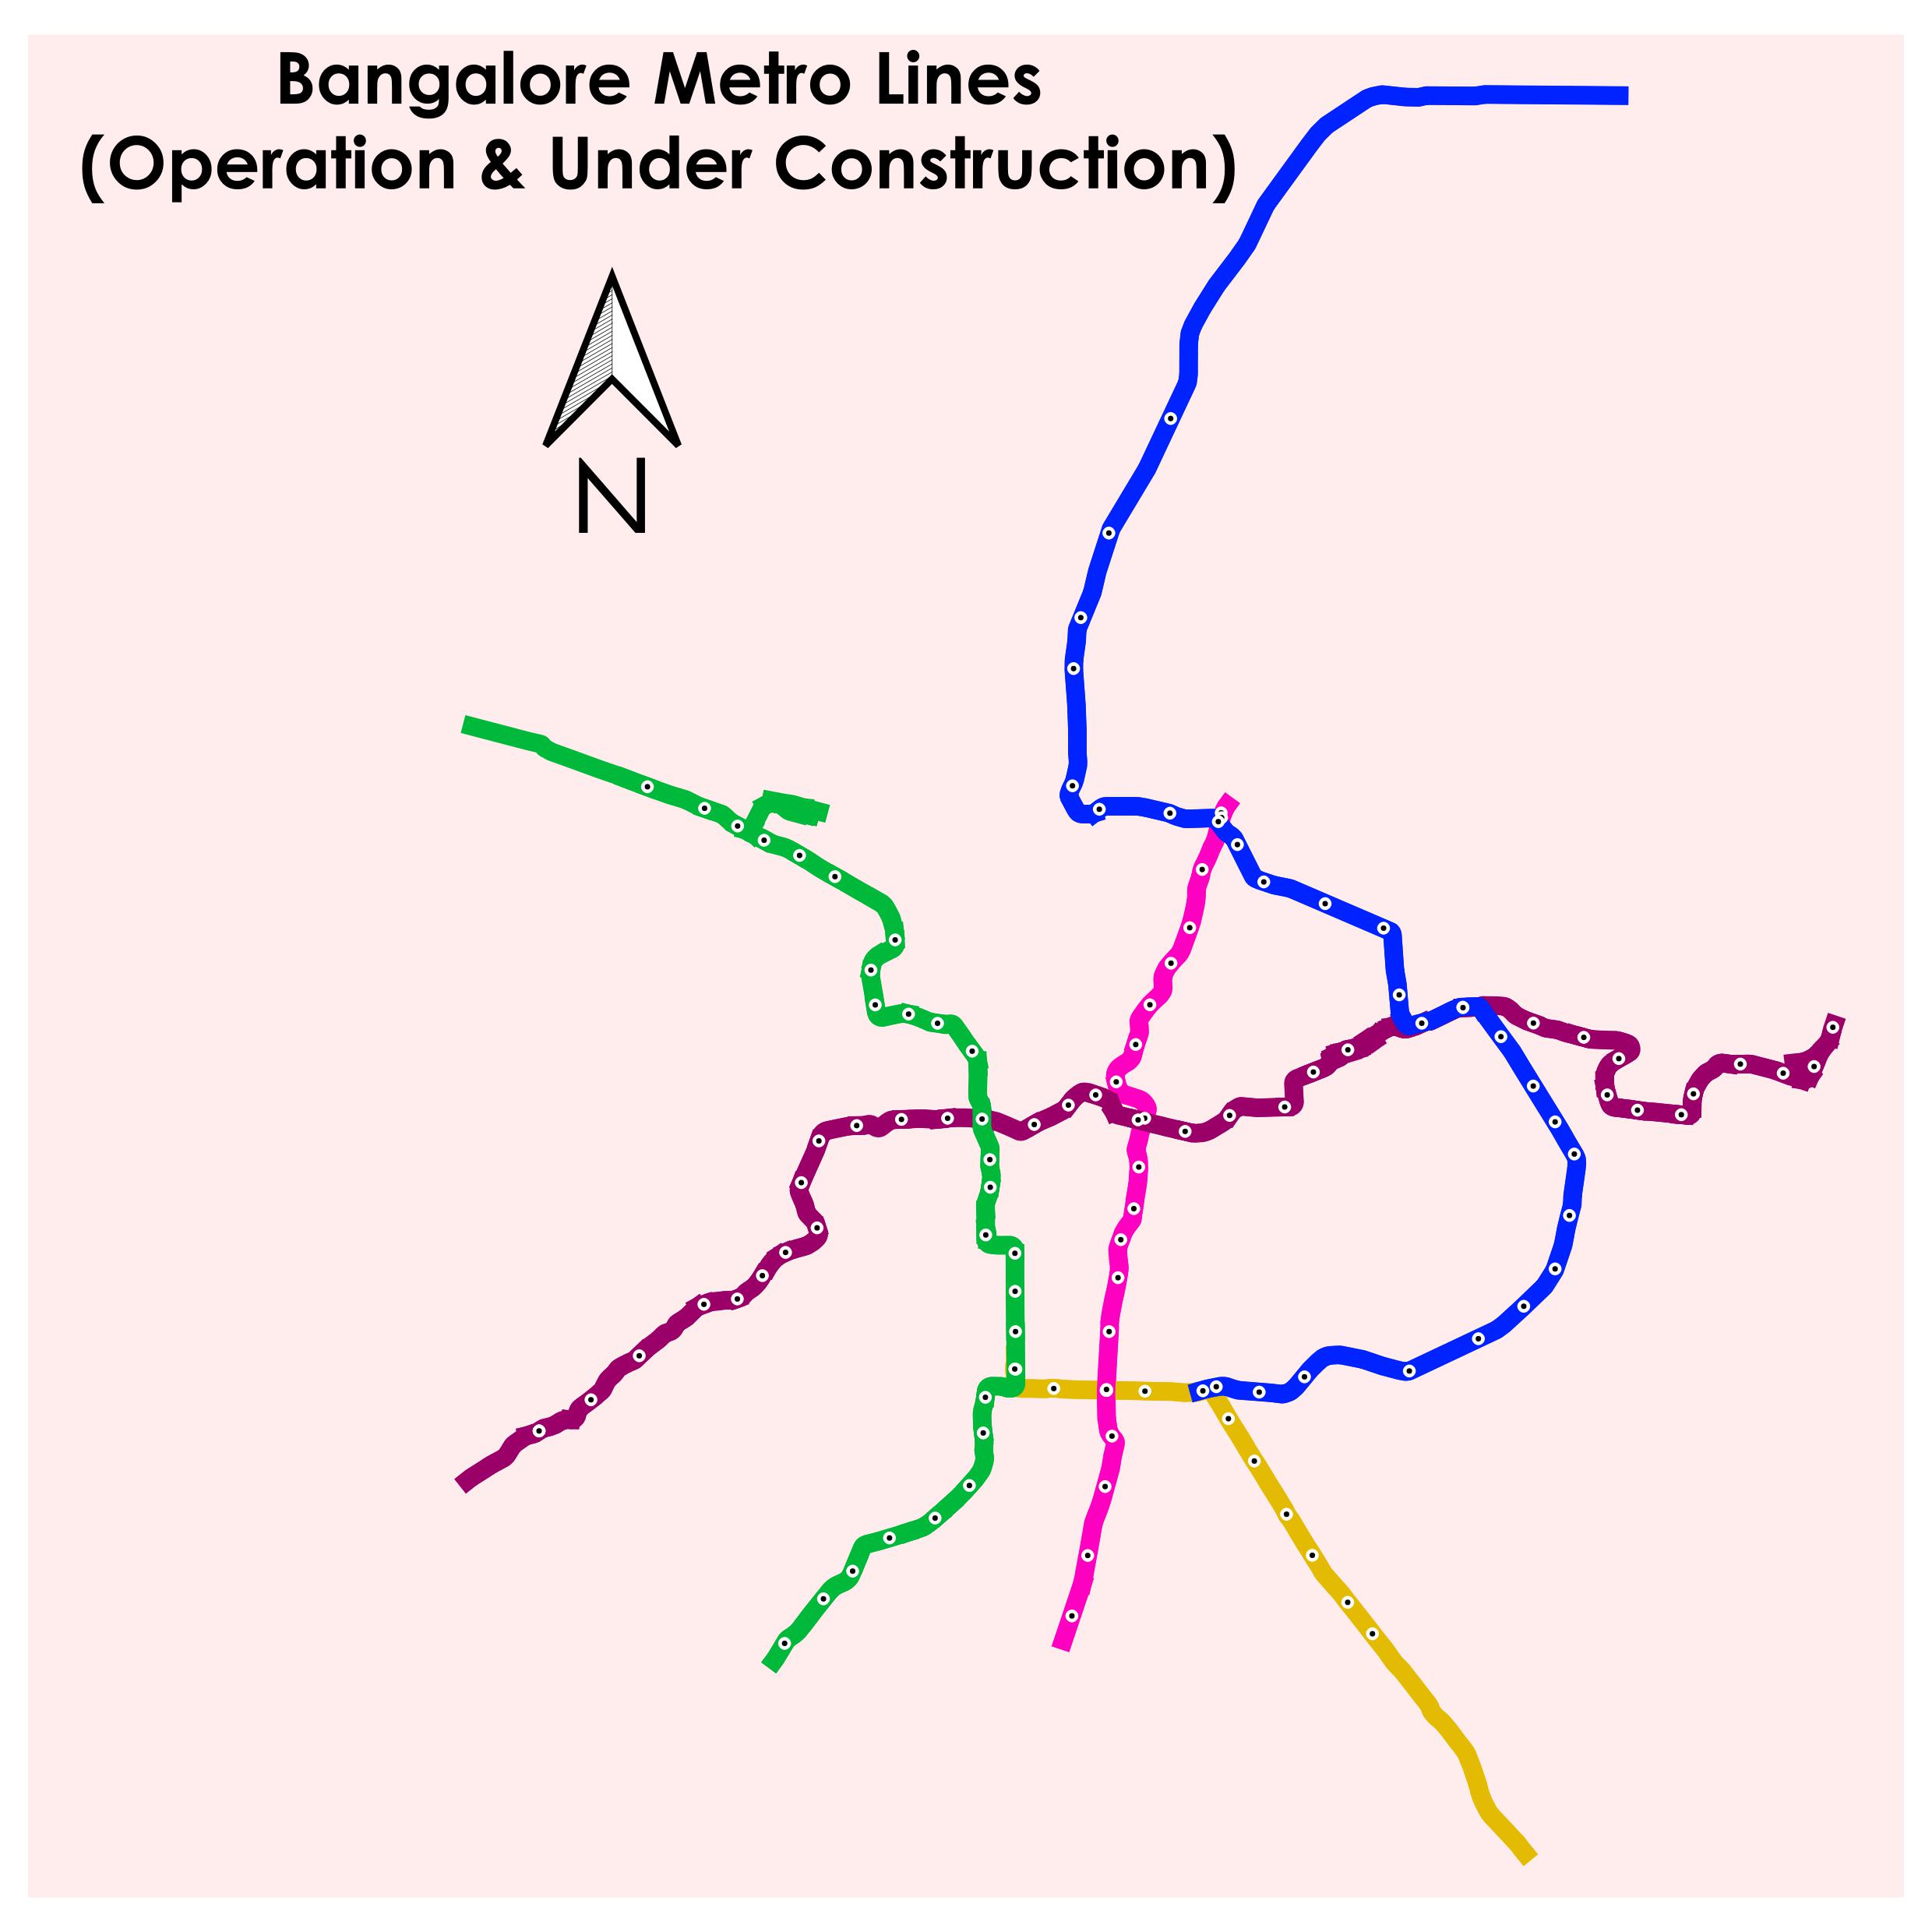
Day 16 - Minimal
The theme throws a question to you- “How minimal can you go?” Namma Metro’s lines - operational and under construction were the dataset I used. Each metro lines have a specific colour, which helped me in making the map as minimal as below.
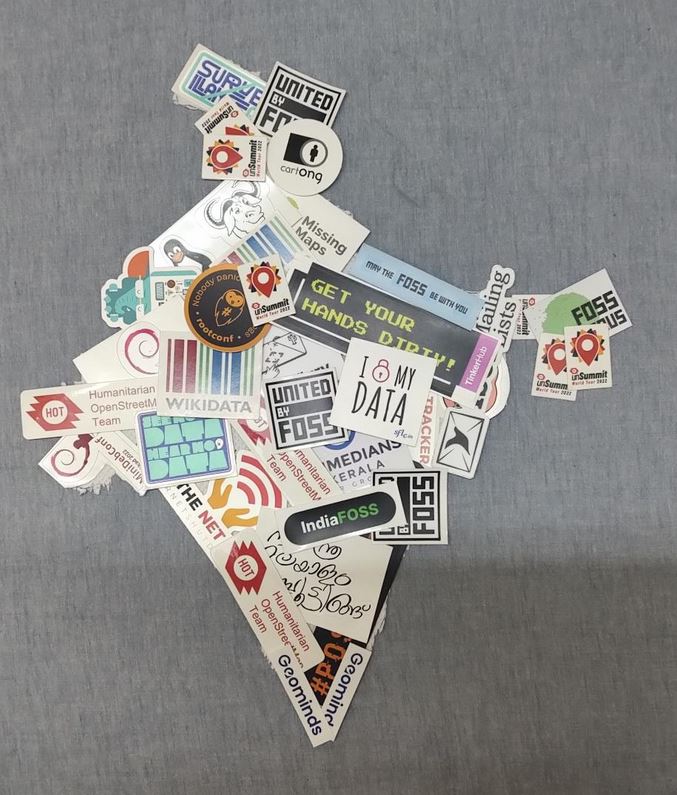
Day 17 - A map without a computer
This was the most challenging one for me in the whole challenge (among those for which I tried making a map). I have a habit of collecting stickers related to FOSS, data, maps etc. Why not a map with those? An India map was created with the stickers I got from different events where I went to speak about #Maps and GeoData. I used 34 stickers of different sizes and shapes to make the shape of India which was about 30cm in height.
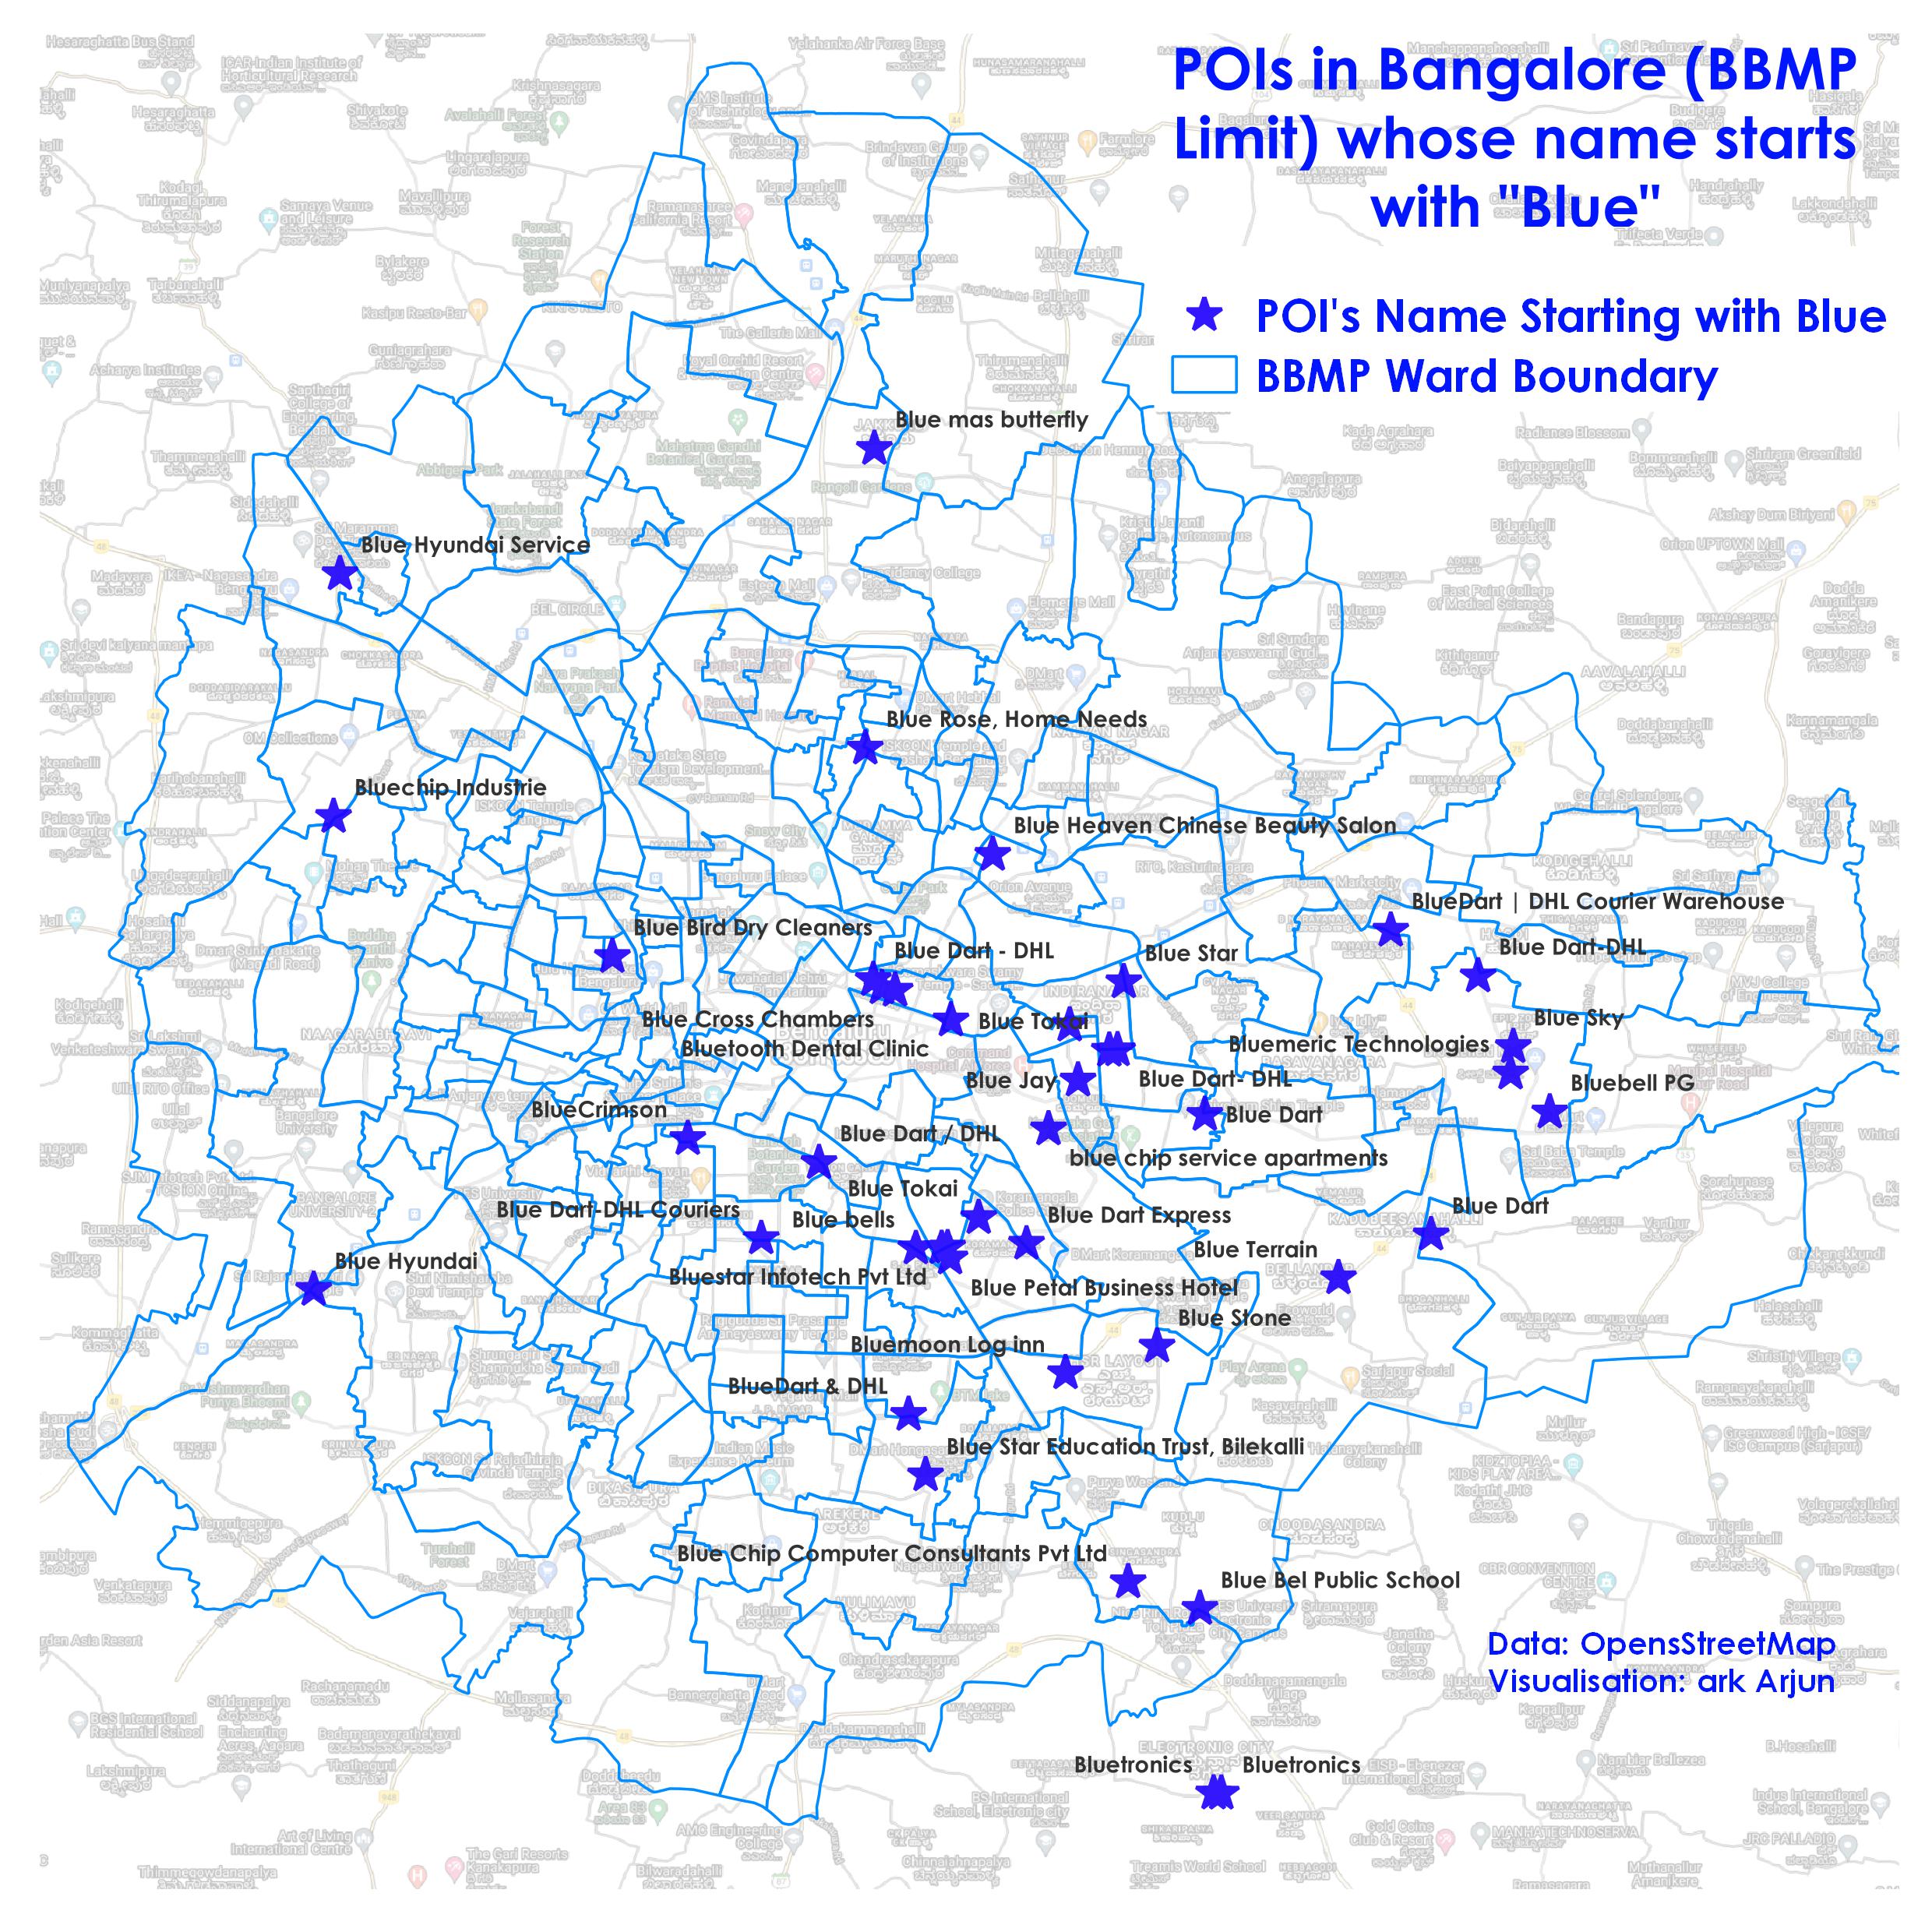
Day 18 - Colour Friday: Blue
The theme was to prepare a map containing green colour. As usual hearing the word blue the first thing that came to mind was water. But wanted to do something different. So I tried playing with Point of Interest(POI). The map shows all the POI mapped in OpenStreetMap which has its name starting with BLUE
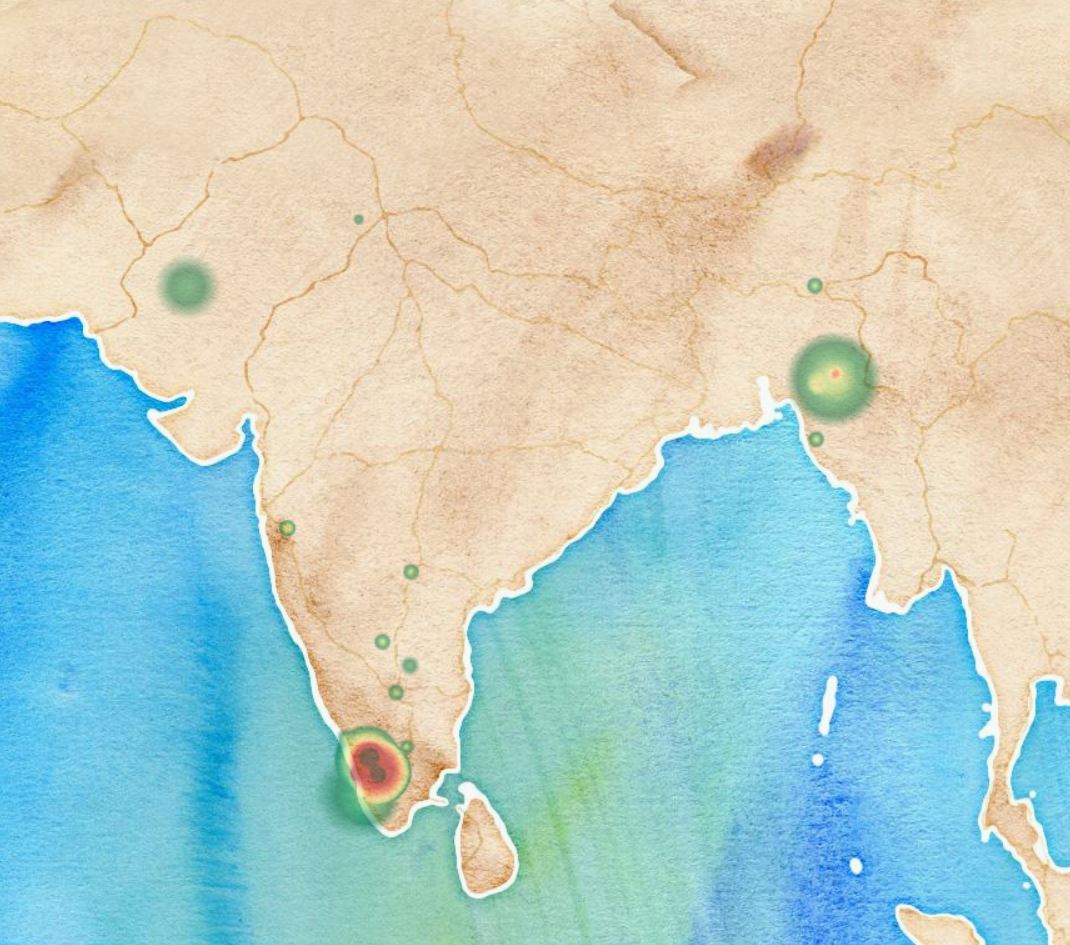
Day 20 - My favourite…
The theme gives you the freedom to map anything which you like. I love mapping irrespective of what I am mapping especially when it is for any open data project. Nothing else will be apt other than this heat map - a heat map of all my OpenStreetMap edits.
Some Postscripts
All the data I used to prepare are from OpenStreeetMap/Open Data. All the tools I used to prepare the maps were FOSS tools except for some Instagram text in the first map. I managed to make 12 maps much better than last time. Do let me know your comments and favourite map among the twelve @arkarjun