Fix Doesnt Count Until Its Whole

Published: 27 August, 2026

10 mins(s) read


Series: Platform Engineering: Building, Defending and Becoming It
Posts from "Platform Engineering: Building, Defending and Becoming It" series:
Table of contents:
This is first in a series Platform Engineering: Building, Defending and Becoming It, an attempt to walk you through the learnings from journey of building a geospatial platform, especially through the contsradictions with regular theory of Product Developement.
License: This article is licensed under the Creative Commons Attribution-ShareAlike 4.0 International (CC BY-SA 4.0) license.
Preface
Most data platforms fail before anyone opens a laptop to build them. The team rarely picks the wrong database or the wrong cloud. What actually sinks the project is nobody agreeing on what “done” meant before the migration started.
For years, the geospatial pipeline I worked in pulled data from a dozen different places: different satellite providers, different field survey formats, different internal teams, with no single structure tying any of it together. Every project quietly reinvented how it stored and queried its own raster and vector data. Delivery took up to weeks per cycle, and most of that time went into reconciling formats and chasing down inconsistencies rather than doing any actual analysis. Nobody caused this on purpose. It’s just what happens when a fast-growing data team ships project by project instead of building one system everyone shares and reuses.
Share and reuse, that’s really all a platform is. Not a buzzword, just the plain difference between everyone solving the same problem alone and one team solving it once for everyone.
I ended up owning the fix for these, and I couldn’t pause a single project running on top of the mess to do it. That constraint turned out to be the whole education. This is the story of that journey, the least glamorous part of the job.
Phased Rollout - The Theory Fails
Imagine a situation where your standard manuals, conventional playbooks, or cheat codes, none of them is working. I started from there. Every product playbook says the same thing: ship the smallest useful version, get it in front of users, iterate in the open. It’s good advice, and I still believe most of it. But it assumes you’re adding something new. It falls apart the moment you’re replacing something people already depend on every day.
A phased version of an existing system keeps the old one’s name and loses the old one’s job. If the old workflow could do 50 things and your new one does 20 of them well, nobody can fully switch off the old one, so now there are two systems running side by side instead of one, and you’re paying for both. Call that 40 percent of a platform if you want; what your users experience is a second full system bolted onto the first. That’s not an MVP. It’s a roof resting on columns and beams, no walls, no windows, no doors, and calling it a house because the shape is right from a distance.

A roof resting on columns and beams versus a complete house: the same shape from a distance, not the same thing to actually live in. (Image:AI Generated)
The residents won’t occupy a house like that, and your users won’t adopt a platform like that either. Adoption is your problem, not theirs; they’re already happy enough with what they have. Your new system can be technically sound and still get almost no adoption if it doesn’t clear the bar the old one already set. Think of the energy it takes to knock an electron out of its atom: below that threshold, nothing happens no matter how close you get, and above it, the electron leaves. Adoption works the same way. That threshold isn’t always turnaround time either; sometimes it’s ease of use, sometimes it’s how much control someone keeps over execution, sometimes it’s plain accuracy or something else. Every system has its own mix of these, and unless you know which ones your users actually weigh, matching them is guesswork. The fix doesn’t count until it’s actually whole. For an analyst who’d been around long enough to remember which folder held which product for what use case, finding the data was never the problem, so a catalogue built only to make things easier to find would have meant nothing to them.
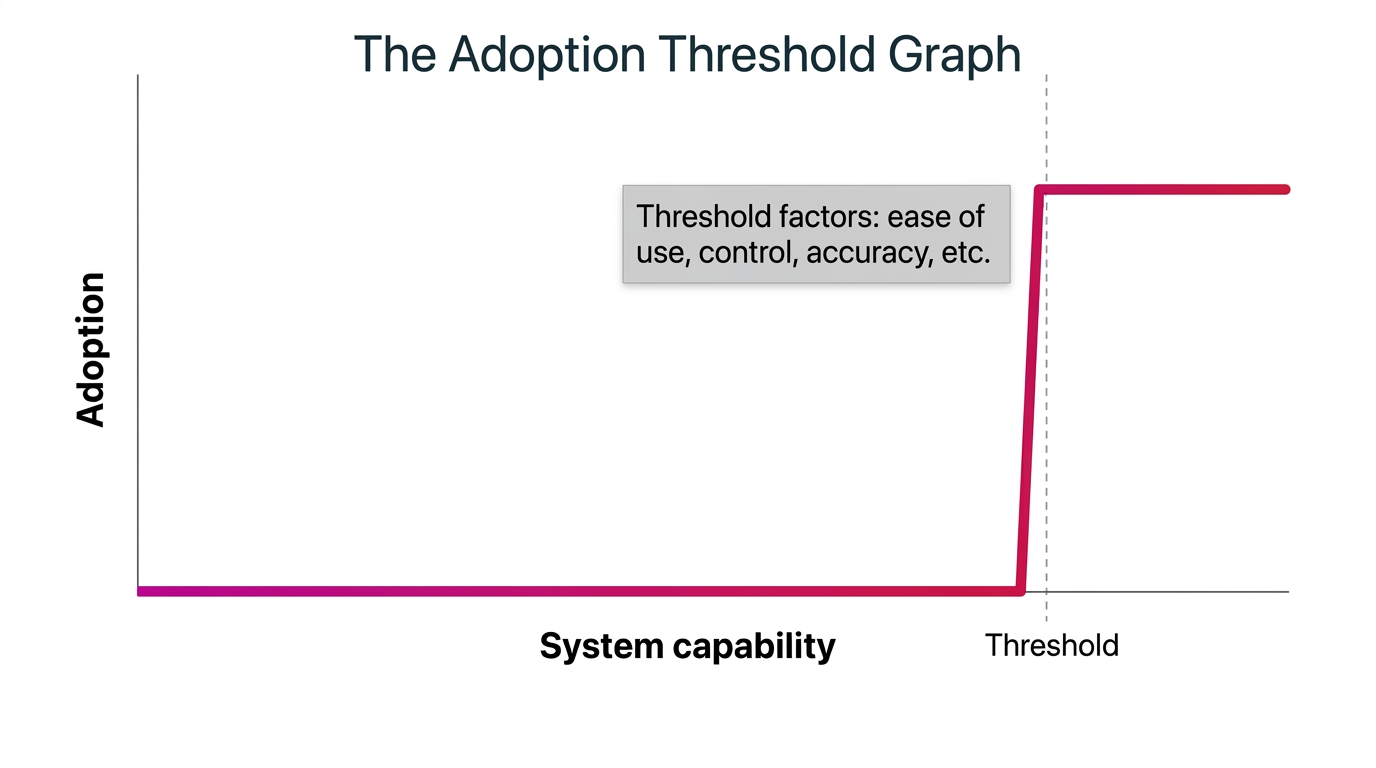
The Adoption Threshold: below it, nothing happens no matter how close you get. Above it, adoption follows, whether the threshold is turnaround time, ease of use, control, or accuracy. (Image:AI Generated)
Satellite data comes down as rasters, grids of pixel values, and the boundaries anyone actually cares about, a district, a village, or a plot, come as vectors. Neither means much to an end customer on its own. The translation is getting the representative numbers (in geospatial terms, zonal statistics): take every pixel inside a boundary and collapse it into one representative number, area under crop, mean temperature, cumulative rainfall, whatever the actual question is. Do that boundary by boundary, and you have something a customer can act on. Most of those boundaries, administrative ones especially, don’t change. If the geometry is constant, there’s no reason to run that extraction fresh every time a downstream pipeline needs it. I decided to build the storage - a data lake to store these extraction results once and feed it to every pipeline that needed it afterwards, instead of a dozen teams each re-deriving the same statistics from the same rasters in their own silos. Wonderful piece of workflow to automate, isn’t it? As any other product person, I was also thrilled. The catalogue of rasters was made on STAC for machines, eventually standardised as the single mode of delivery even to the expert analysts. The selling point to them was not finding the data easier; it was faster retrieval of data and the value-added use case of retrieving the data only for the required region and not as a whole. That’s how the build of a STAC catalogue standardised how every product got described and queried: consistent metadata for spatial extent, temporal range and product type - the same information a person used to carry in their head, now sitting in something anyone could query.
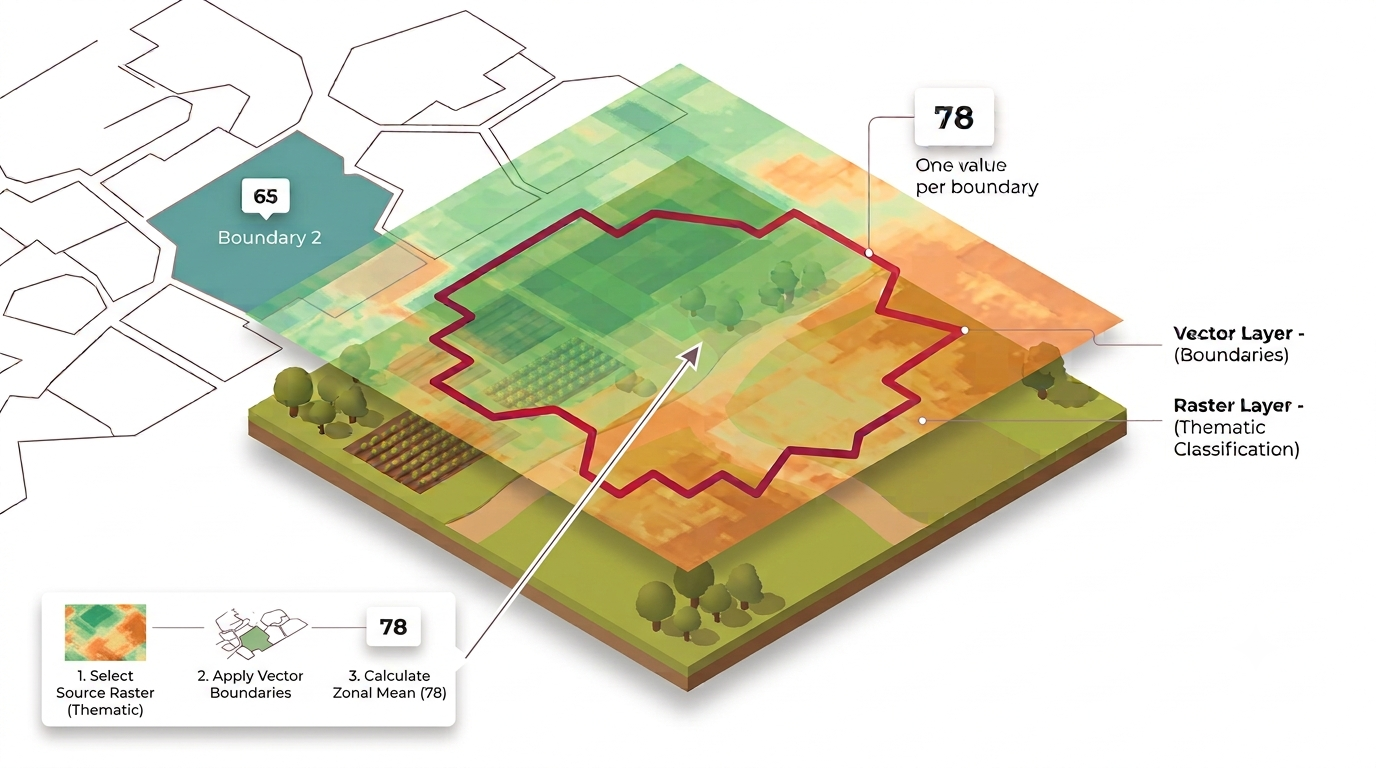
Zonal statistics: every pixel inside a boundary, however irregular its shape, collapsed into one representative number. (Image:AI Generated)
Automating that extraction created a problem the manual version never had. When the work was still done by hand, quality control happened without anyone calling it that: a person looked at what came out before passing it along, caught the obvious problems by instinct, and never wrote any of it down as a rule. Automate the extraction and you inherit its speed and lose that instinct in the same breath. The answer wasn’t to go back to someone eyeballing every output. It was to find out exactly what that person had been implicitly checking for, every edge case they’d learned to catch without ever naming it, and build the automation to match that same quality bar before anyone downstream was allowed to trust it. Until it did, the automation wasn’t saving anyone time; it was just moving the same risk further down the pipeline, faster. That’s where requirement gathering actually earned its keep here, not writing down what the new system should do, but excavating what the old one, and the people running it, already knew and had never written down.
None of that was allowed to exist as 40 percent. The catalogue only started earning its keep once it covered close to the full spread of products it was meant to describe, somewhere north of 95% of the raster data flowing through it. Below that threshold, it wasn’t a catalogue, it was one more place to check in addition to the old ones. Only once both the catalogue and the quality gates were actually complete did that weeks-long delivery cycle come down to days.
There’s a trick hiding in that word, catalogue. Picture a regular supermarket shopper handed a slick new catalogue app that points to exactly which aisle carries her usual items. She gets nothing from it, she already knows the store by heart. The STAC catalogue works the same way for a team that’s been living inside the same dataset for years. I can’t honestly claim it eased their work, there was no friction there left to ease. It earns its keep for the team two desks over who’s never touched that data before, and would otherwise have spent a day just finding it. That unevenness, real value for some, none at all for others, using the exact same system, is the first crack in the idea that adoption is ever just one clean number.
Wholeness has a second axis I didn’t count the first time through: whether the people who need the system can actually use it. A catalogue covering 95 percent of the data still fails if its interface only speaks a language half its intended users don’t read. I’ve had a customer team lean on me to translate a query into English and the answer back into the language they actually work in, every single time, because the tool itself never learned to. That made me a permanent stand-in between the system and the people it was supposedly built for, which defeats the point of building it at all. The real fix is enabling the person on the other side to open the thing themselves, with me nowhere in the loop. Coverage without access is a smaller version of the same 40 percent problem, just measured on a different axis.
Half a System Is a Different, More Dangerous Thing
I don’t think this is an abstract product-theory point, and I don’t think geospatial is a special case. It shows up everywhere someone tries to replace a system in pieces.
Camille Fournier and Ian Nowland tell a version of my own story in their book Platform Engineering, close enough that I underlined it twice. A team building a new service delivery platform got a year into the rollout with under 5% of production traffic actually on it, while still paying to keep the old platform running at full scale for everyone else. Net result: worse off than before they started, carrying the cost of two systems for the value of neither. Their own diagnosis of what went wrong is blunt: they had left adoption to a “build it and they’ll come” mindset instead of treating the migration itself, the off ramp from the old platform and the on ramp to the new one, as part of the build. It only turned around once they built that path deliberately, with a way to dial traffic over gradually while promising close to zero downtime. A year later they were at full migration and their delivery times had improved by 65%, not the 50% they’d originally targeted.
Everything so far has been about internal tools nobody outside a company ever sees. It’s worth asking whether the same logic holds when the stakes are real money and a stranger’s trade, not just an internal SLA. On the morning of August 1, 2012, Knight Capital Group, an American financial services company, lost around $460 million in 45 minutes. The technical cause, once the SEC finished picking it apart, was almost embarrassingly small: during a system replacement, one of 8 servers didn’t get the new code. That one server still had an old flag wired to dead legacy logic, logic nobody had bothered to fully remove because it was supposed to be inactive. When the market opened, that flag reactivated the old behaviour and the server started generating orders against a system that had no idea what to do with them, at scale, while the other 7 servers ran cleanly. Nobody lost $460 million on my old reconciliation scripts, but the shape of the failure is identical. Being complete on 7 out of 8 servers sounds close enough to call it done. It is, instead, the most dangerous number on the list, because everything downstream assumes all 8 are running the same logic.
That’s the part phased-rollout thinking tends to skip. An incomplete replacement doesn’t just disappoint people, it introduces a seam where the old and new behaviours can silently contradict each other, and you usually don’t find out where until something goes through that seam at the worst possible moment.
Completeness solves the technical half of this. It doesn’t solve the other half, proving any of it actually worked, and that turned out to be the part nobody warned me about. We can see that in the next part of the series.
Any comments on the article, let me know @arkarjun or @Medium.